Hi,
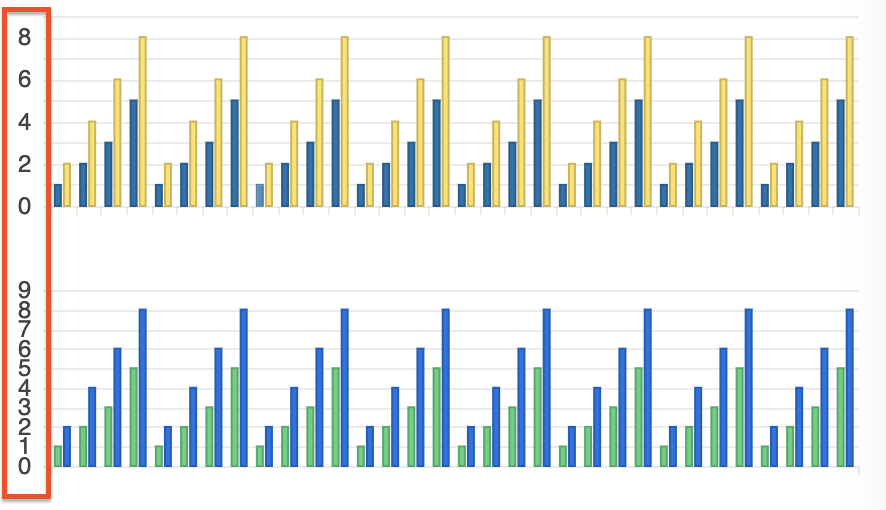
I have prepared a forked stackblitz example for a navigator selection with a shared tooltip:
https://stackblitz.com/edit/angular-h1j1hq-kmmqfg?file=src%2Fapp%2Fapp.component.ts
(I also included a screenshot)
There seems to be now way to have a shared tooltip in this scenario that makes sense, clearly no one needs the duplicated items in the tooltip that origins from the navigator selection pane.
So I would propose a flag for a pane to configure if a pane is included in the shared tooltip.
Or alternatively on the series item level a flag that allows for enable / disable or visible / invisible regarding the shared tool tip.
I think there are other cases where this might come handy to have a shared tooltip for several serieses only over one pane, or exclude specific panes and or serieses.
I tried to make the tooltip invisible, on the series level of the navigator pane but something like:
[tooltip]="{ visible: false }"
inside the navigator series seems to be only applicable to the current series tooltips but not the shared ones.
In a line chart where markers are set to be not visible.
There is no way to increase the hit box of a marker (or line) to be hit if I want to trigger the tooltip of the marker.
The mouse hover obviously works better from it's inherent logic (a click not beeing involved), but triggering the tool tip with a touch gesture seems quite fumbly. One has to hit the line very exactly. Up to a point where one has to try several times to make it happen, which makes it very impractical for new users who might not even know that there are tooltips to be displayed.
For further infos here is my forum thread with more details:
As described there, increasing the marker size does only work when markers are visible.
Making the line thicker might help a little but comes with unwanted optical changes which are impractical for most usecases.
Best Regards,
Leo Härdle
I need to change the background of an area chart at certain values.
I want to display critical threshold. It could be like in the attached photo with some gradient but normal color blocks or even just some straight lines at the thresholds would be okay. Is there any option to achiev something like that?
This feature request is already logged in the Kendo UI for jQuery portal and upon implementation would be nice to bring the feature also to Kendo UI for Angular Charts.
https://feedback.telerik.com/kendo-jquery-ui/1358671-support-quarters-in-date-series-just-like-weeks
We have noticed that the labels on the y-axis are rendered too close together, almost touching each other. This can be configured by setting the step option.
However, it could be ideal in such cases for the step to be determined automatically by the Chart based on the available space (similar to the rotation option which rotates the label, but in this case to control the step).
Please provide an option to automatically render the labels based on the available space.
We've already implemented several Kendo Chart performance optimization techniques, including:
- Canvas Rendering.
- Inline Series Binding.
- Disabling Animated Transitions.
- Disabling Gradients.
- Hiding Minor Grid Lines.
- Date Grouping using Category Axis in Date Mode.
However we are still experiencing issues when using large amounts of data.
Hi team,
Please provide an animate property part of the Tooltip interface and all tooltip-related components:
https://www.telerik.com/kendo-angular-ui/components/charts/api/TooltipComponent/
https://www.telerik.com/kendo-angular-ui/components/charts/api/ValueAxisCrosshairTooltipComponent/
https://www.telerik.com/kendo-angular-ui/components/charts/api/SeriesTooltipComponent/
..etc
Currently, the tooltip animations can be disabled through the tooltipInstance.tooltip property of the Chart reference:
@ViewChild('chart') public chart: ChartComponent;
ngAfterViewInit() {
    this.chart.tooltipInstance.animate = false;
}
Severity: Sev2 (High)
Test Environment: OS: Windows 11 22H2
OS Build: 23620.1000
Pre-Requisite: Set browser zoom level to 400% and display resolution: 1280x1024 (or) In dev Tools set the resolution to 320*256.
Repro steps:
1.Open URL: http://www.telerik.com/kendo-ui in edge browser.
2.Navigate to 'Kendo UI for Angular ' tab item and invoke it.
3.Navigate to the Angular chart control and invoke it.
4.In left navigation pane click Scatter control under 'series types'.
5.Navigate to 'Scatter Plot Chart'.
6.Verify whether X-axis is getting overlapped while resizing the page upto 400% of zoom or not.
Actual Result:
X-axis is getting overlapped while resizing the page upto 400% of zoom.
Expected Result:
X-axis should not get overlapped when browser zoom level set to 400%.
I would like to request a component similar to the old TreeMap widget, but with some added functionality.  It would be great if there were native functionality in the component to drill deeper into a hierarchy rather than always having to look at the top level view (i.e. clicking a sub node would "zoom in" to view it as the new root level node).

This example treemap and sunburst (implemented using d3.js) are along the lines of what I'm suggesting.

http://mbostock.github.io/d3/talk/20111018/treemap.html
http://bl.ocks.org/mbostock/4348373
Hi,
Please provide an ability to set the axis range in the drag/zoom events.
Thanks
Please provide the Charts selection functionality for vertical category axis as well.
thank you
I want to align the Chart Plot Area on the left side (similar to the position property of the Legend component).
Currently, the same can be achieved only with the Drawing API in render event handler. Here is an example:
https://stackblitz.com/edit/angular-ucwo6p
Providing a built-in position option for alignment of the Plot Area will be an easier and intuitive appraoch.
Thanks.
It would be great if your pan and zoom had sliders to more easily navigate a long duration chart.
See these couple examples: https://www.amcharts.com/demos/line-chart-with-range-slider/ https://www.amcharts.com/demos/zoomable-value-axis/
Please provide a global Charts font property that allows to set the font for all Chart elements.
Thank you.
Using a line chart, using date in the category axes, it will be useful to use the format "week number".
See your example: https://47hbw1.run.stackblitz.io
It doesn't look available from this list: https://github.com/telerik/kendo-intl/blob/develop/docs/date-formatting/index.md
Hi,
In the current implementation of the Kendo Chart, I'm utilizing the "panable" feature to enable movement of the chart horizontally. However, after zooming, I would prefer to utilize scrollbars instead of dragging to navigate through the chart. I would like to request a feature that allows for this behavior.
Thank you for your consideration.
Hello,
The feature applies mainly to scatter plots and is as follows:
* The user has the ability to select individual data points by clicking on them after which they are highlighted.
* The user has the ability to select regions of points by clicking and dragging. These regions can be a lasso, rectangle, oval, free form, or any other shape.
* The user has the ability to select multiple points or regions of points simultaneously (i.e. previously selected points/regions don't "unselect" when the user selects new ones).
An example of this is this Lightning Charts example: https://lightningchart.com/lightningchart-js-interactive-examples/edit/lcjs-example-0040-customLassoInteraction.html?isList=true
I'm also attaching a script that you can copy and paste into the example above which shows the ability to select rectangular regions and individual data points.
We have a case with a chart with values: Date-Value that only applies to working days.
Non of the current options of missingValues ("gap" | "interpolate" | "zero") suits us. Interpolate is the closest option but it pretends to have 2 additional points (Sat & Sun) between Friday and Monday while we prefer just to connect directly Friday and Monday so both label and chart-line shape showns that 4 weeks (28 days) data based chart is based on 20 points and not 28 points (20 real points and 8 interpolated points).
Can this be achived currently? If not can you extend missingValues with additonal option (eg. "ignore") to do as explained above?
Thanks,
Tomasz