Currently missing values can be either interpolated (with the same dash type), zero or gap. It would be nice to provide the opportunity to configure the dash type for the missing (interpolated) values and have for example a solid line for the existing values, and dashes for the interpolated portion.
I have the following data:

Price   Downloads
59      10
62      15
69      30
70      10
75      25
78      30

I want to present the data in a chart in such a way that the Price are grouped together and the Downloads have their medians.

So it would be:
< 59:   10
61-70:  (Median of 62, 69 and 70 above)
71-80:  (Median of 75 and 78 above)

X-axis would be the Price then Downloads on Y-axis.

I can create the median but I just want to be able to group the X-axis.
Provide the animation once select or deselect the legend the visible line in chart should rerender with animation
Charts that use one or more value axis should expose the means to specify which values on that axis are labeled, instead of basing the labels on the min value of the axis and the major unit.

Ex, using the Angular syntax:

<kendo-chart-value-axis-item
  min="0"
  max="10"
  [labelsAt]="[2.5, 4, 7]"
>

yielding an axis like

----------|------|------------|------------
          2.5     4             7
Can you implement a new chart like the below reported?
It's a bubble chart without considering the xaxis


https://bl.ocks.org/alokkshukla/3d6be4be0ef9f6977ec6718b2916d168
Please provide a global Charts font property that allows to set the font for all Chart elements.
Thank you.
It would be great if your pan and zoom had sliders to more easily navigate a long duration chart.
See these couple examples: https://www.amcharts.com/demos/line-chart-with-range-slider/ https://www.amcharts.com/demos/zoomable-value-axis/
Please provide the Charts selection functionality for vertical category axis as well.
thank you
I want to align the Chart Plot Area on the left side (similar to the position property of the Legend component).
Currently, the same can be achieved only with the Drawing API in render event handler. Here is an example:
https://stackblitz.com/edit/angular-ucwo6p
Providing a built-in position option for alignment of the Plot Area will be an easier and intuitive appraoch.
Thanks.
Hi,
Please provide an ability to set the axis range in the drag/zoom events.
Thanks
Hi,
Please provide an option to render a Legend for the Chart Pane components.
thanks
Hi Kendo Theme,
The current behavior will re-render the Chart and the tooltip or crosshair disappear and the user will need again to hover over the series. This behavior can be observed in the following example:
https://stackblitz.com/edit/angular-dmpexe-sf8zoj?file=src%2Fapp%2Fapp.component.ts
The desired behavior would be to keep the popup open or the crosshair present when updating the data.
Thank you for your consideration.
Currently, the Radar Chart cannot be zoomed in/out. Please, provide a zoomable property that would allow the developer to achieve this functionality.
Hello,
The feature applies mainly to scatter plots and is as follows:
* The user has the ability to select individual data points by clicking on them after which they are highlighted.
* The user has the ability to select regions of points by clicking and dragging. These regions can be a lasso, rectangle, oval, free form, or any other shape.
* The user has the ability to select multiple points or regions of points simultaneously (i.e. previously selected points/regions don't "unselect" when the user selects new ones).
An example of this is this Lightning Charts example: https://lightningchart.com/lightningchart-js-interactive-examples/edit/lcjs-example-0040-customLassoInteraction.html?isList=true
I'm also attaching a script that you can copy and paste into the example above which shows the ability to select rectangular regions and individual data points.
Hello ,
Kindly Have issue with stacked bar when try to draw two items in chart with specified with as the below
<kendo-chart-series>
  <kendo-chart-series-item type="bar" [stack]="{ type: '100%' }" [data]="[97]">
  </kendo-chart-series-item>
  <kendo-chart-series-item type="bar" [stack]="{ type: '100%' }" [data]="[7]">
  </kendo-chart-series-item>
</kendo-chart-series>
Can Anyone help on that ?
Severity: Sev2 (High)
Test Environment: OS: Windows 11 22H2
OS Build: 23620.1000
Pre-Requisite: Set browser zoom level to 400% and display resolution: 1280x1024 (or) In dev Tools set the resolution to 320*256.
Repro steps:
1.Open URL: http://www.telerik.com/kendo-ui in edge browser.
2.Navigate to 'Kendo UI for Angular ' tab item and invoke it.
3.Navigate to the Angular chart control and invoke it.
4.In left navigation pane click Scatter control under 'series types'.
5.Navigate to 'Scatter Plot Chart'.
6.Verify whether X-axis is getting overlapped while resizing the page upto 400% of zoom or not.
Actual Result:
X-axis is getting overlapped while resizing the page upto 400% of zoom.
Expected Result:
X-axis should not get overlapped when browser zoom level set to 400%.
Hi team,
Please provide an animate property part of the Tooltip interface and all tooltip-related components:
https://www.telerik.com/kendo-angular-ui/components/charts/api/TooltipComponent/
https://www.telerik.com/kendo-angular-ui/components/charts/api/ValueAxisCrosshairTooltipComponent/
https://www.telerik.com/kendo-angular-ui/components/charts/api/SeriesTooltipComponent/
..etc
Currently, the tooltip animations can be disabled through the tooltipInstance.tooltip property of the Chart reference:
@ViewChild('chart') public chart: ChartComponent;
ngAfterViewInit() {
    this.chart.tooltipInstance.animate = false;
}
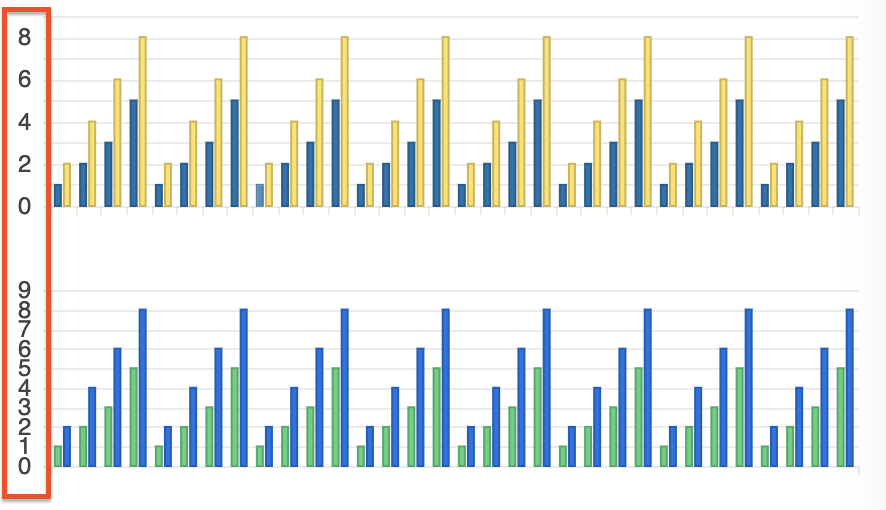
We have noticed that the labels on the y-axis are rendered too close together, almost touching each other. This can be configured by setting the step option.
However, it could be ideal in such cases for the step to be determined automatically by the Chart based on the available space (similar to the rotation option which rotates the label, but in this case to control the step).
Please provide an option to automatically render the labels based on the available space.