We would like to request updating the Azure library for uploading files to Azure Blob Storage.
The WindowsAzure.Storage library has been deprecated and is no longer maintained.
In my AJAX web applications I am using RadScriptManager. However, it seems that the "integrity" directive is not supported by RadScriptReference.
E.g.:
<telerik:RadScriptManager ID="RadScriptManager1" runat="server">
    <Scripts>
            <telerik:RadScriptReference  Path="https://code.jquery.com/jquery-3.7.1.js" integrity="sha384-NdBrHQkGhjPzZhn" crossorigin="anonymous" />
        <telerik:RadScriptReference Path="https://code.jquery.com/jquery-3.2.1.slim.min.js" integrity="sha384-KJ3o2DKtIkvYIK3UENzmM7KCkRr/rE9/Qpg6aAZGJwFDMVNA/GpGFF93hXpG5KkN" crossorigin="anonymous" />
    </Scripts>
</telerik:RadScriptManager>Hello Team,
In Editor, proportional resize of image (by holding Shift and dragging) is not working unlike in Word.
Could you please suggestion for adding the same in Editor.
Thanks.
In case where the y-axis minimum value < 0 the x-axis label appears below the y=0 line and not below the chat. I am however able move the x-axis label to be below the chart by setting RadHTMLChart.PlotArea.YAxis.AxisCrossingValue = the minimum value on the y-axis.
However the y=0 line on the chart is no longer prominent on the chart. I was advised to use a jQuery-type solution to move the label without affecting the appearance of the y=0 line on the chart:
 <telerik:RadScriptManager ID="RadScriptManager1" runat="server"></telerik:RadScriptManager>
         <script>
             function kendoChartInitializing(sender, args) {
                 //move just the Title of the axis
                 args.xAxis.title.padding = { top: 80 }
             }
         </script>
Please provide a code-behind or design time feature to set this property instead of resorting to a jQuery-type method.
When inserting video in Telerik Editor, radEditor by default inserts it using <embed>.
This element is not supported by Edge. Many modern browsers now support/recommend to use of the <video> tag.
So, that it will render video in most of Chromium browsers out there.
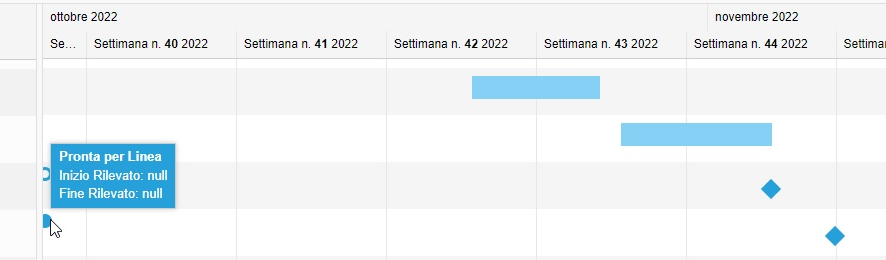
In "Planned vs Actual" scenario, and we noticed a strange behaviour when we have same task Start and End date, and both planned dates null: in this case a circle ("planned" symbol) appears on the left side of gantt chart... but planned dates are null.
When task Start and End dates are different, and planned dates are null, the circle correctly does not appear.
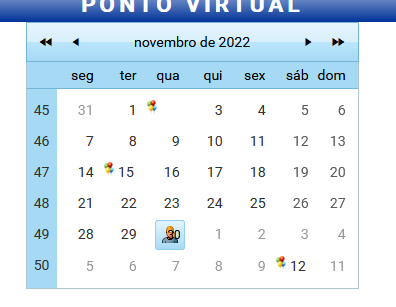
There is no property indicating the next DateTime that user is going to,
for example, we are in November/2022 and the end user click on "<" back button,
the event return the current date.
RadCalendar1_OnHeaderCellRenderthe var nMes = cal.FocusedDate.Month; to return the current month.
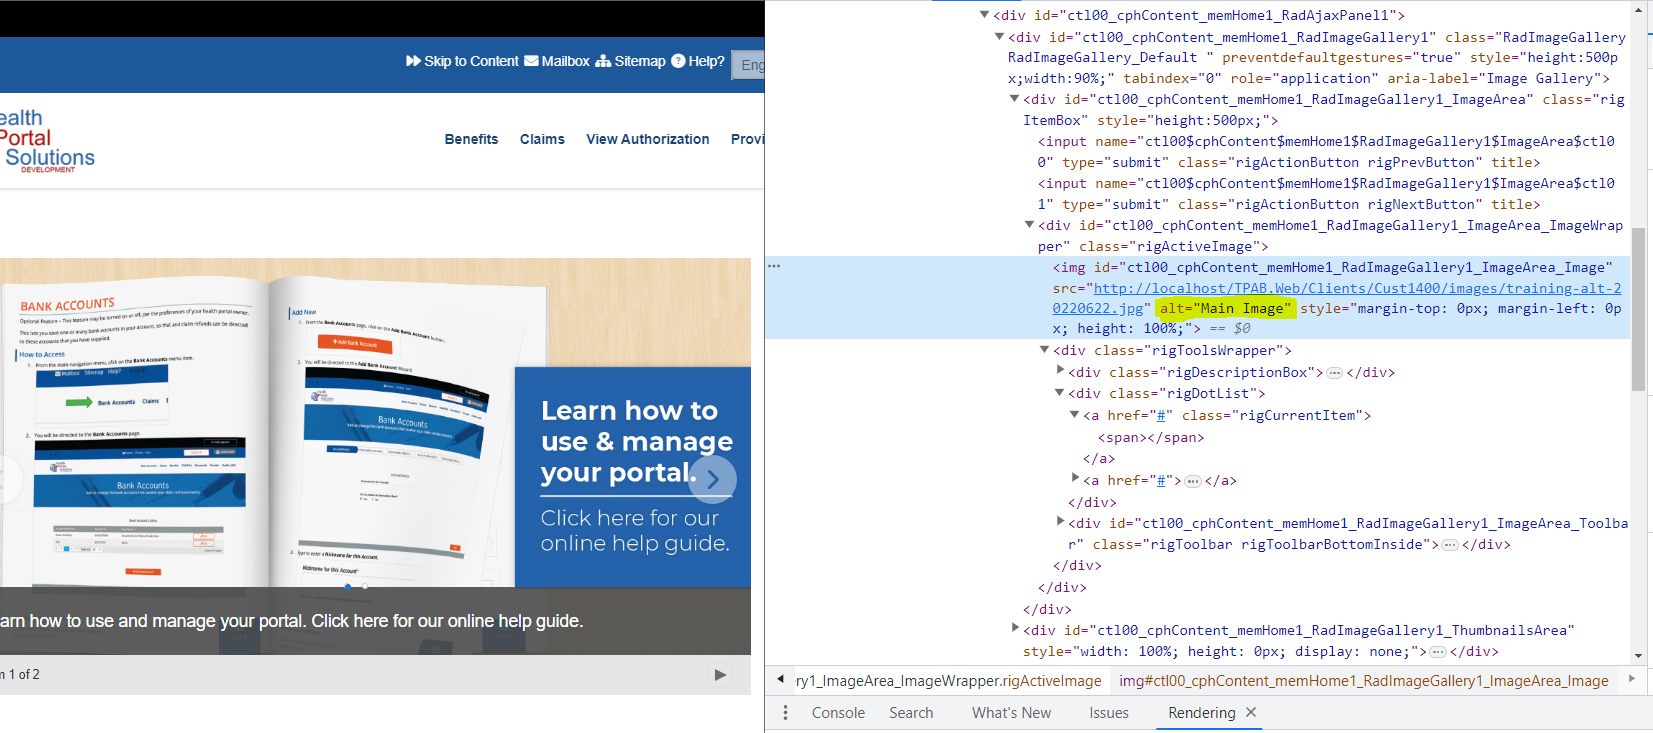
Currently, it's not possible to add Alt text to ImageGalleryItem. By Default it will add "Main Image" as alt.
We can do it in Image Thumbnail but not in the Image Gallery Item, this causes issue with the W3CAG which requires to add alt text to image.
It will be great add on if we can implement this feature to make RadImageGallery accessible.
We have requirements for 3 HtmlCharts showing related data, all with the same dates on the X-axis. There would be too much data to put all series on a single chart.
Each chart has a Navigator. When we want to view a timeframe different to the default, all charts must have the Navigator adjusted separately. It would be a useful feature if a single navigator could change the display of multiple charts.
Right now when hiding individual entries in RadHtmlChart the percentage will change so that the visible items always add up to 100%.
For the data we're displaying, we need to have an option for the percentage to still be the original percentage.
For example. if there are five items that are 20% each, if I hide one I want the other four to remain at 20% and the total to now only add up to 80%.
The current behaviour would instead change these all to 25% each with the total being 100%, which for our purposes is displaying inaccurate data to the user.
ResizeGridOnColumnResize is not working the same way when Grid has StaticHeaders.
I want to resize the grid based on the contents and still be able to scroll with headers.
Hi , help to change the RadChart To RadHtmlChart for line chart series , below is the existing code used RadChart . i need to update to RadHtmlChart
hartAnalysis_BLL objBLL = new ChartAnalysis_BLL();
DataTable dt = objBLL.GetMonthlySSMTotalQuantityImported(arrParameters);

// Create new chart
RadChart2.ChartTitle.TextBlock.Appearance.TextProperties.Font = new System.Drawing.Font(RadChart2.ChartTitle.TextBlock.Appearance.TextProperties.Font.FontFamily, 11, System.Drawing.FontStyle.Bold);
RadChart2.ChartTitle.TextBlock.Text = "Extended Monthly SSM Total Quantity Imported \n(" + ssm[0] + ")";
RadChart2.Width = AppConstants.CONST_CHART_WIDTH;
RadChart2.ChartTitle.Visible = true;
RadChart2.Chart.DefaultType = ChartSeriesType.Line;
RadChart2.PlotArea.Appearance.Dimensions.Margins.Left = Telerik.Charting.Styles.Unit.Percentage(10);
RadChart2.PlotArea.Appearance.Dimensions.Margins.Right = Telerik.Charting.Styles.Unit.Percentage(15);
RadChart2.PlotArea.Appearance.Dimensions.Margins.Bottom = Telerik.Charting.Styles.Unit.Percentage(30);

RadChart2.DataManager.ValuesXColumn = "Date";
RadChart2.DataManager.ValuesYColumns = new string[1] { "SSM Quantity" };
RadChart2.IntelligentLabelsEnabled = true;
RadChart2.DataSource = dt;
RadChart2.DataBind();
RadChart2.Skin = AppConstants.CONST_TELERIK_CHARTSKIN;

RadChart2.PlotArea.XAxis.Clear();
RadChart2.PlotArea.XAxis.IsZeroBased = false;
RadChart2.PlotArea.XAxis.AutoScale = false;
RadChart2.PlotArea.XAxis.Appearance.ValueFormat = ChartValueFormat.ShortDate;
RadChart2.PlotArea.XAxis.Appearance.CustomFormat = "MMM yy";
RadChart2.PlotArea.XAxis.AxisLabel.Visible = true;
RadChart2.PlotArea.XAxis.AxisLabel.TextBlock.Text = "Month \n(" + AppFunctions.GetDisclaimer() + ")";
RadChart2.PlotArea.XAxis.AxisLabel.TextBlock.Appearance.TextProperties.Color = System.Drawing.Color.Black;
RadChart2.PlotArea.XAxis.Appearance.LabelAppearance.RotationAngle = -45;

RadChart2.PlotArea.YAxis.AxisLabel.Visible = true;
RadChart2.PlotArea.YAxis.AxisLabel.TextBlock.Text = "Total Quantity of SSM Imported (" + dt.Rows[0]["UOM"] + ")";
RadChart2.PlotArea.YAxis.AxisLabel.TextBlock.Appearance.TextProperties.Color = System.Drawing.Color.Black;

RadChart2.Series.GetSeries(0).Appearance.PointMark.Dimensions.Width = 1;
RadChart2.Series.GetSeries(0).Appearance.PointMark.Dimensions.Height = 1;
RadChart2.Series.GetSeries(0).Appearance.PointMark.FillStyle.MainColor = System.Drawing.Color.Black;
RadChart2.Series.GetSeries(0).Appearance.PointMark.FillStyle.FillType = FillType.Solid;
RadChart2.Series.GetSeries(0).Appearance.PointMark.Visible = true;
RadChart2.Series.GetSeries(0).Appearance.LineSeriesAppearance.Color = System.Drawing.Color.Orange;
RadChart2.Series.GetSeries(0).Appearance.LineSeriesAppearance.Width = 3;

int intYear = dt_SelDateFrom.Year;
int intMonth = dt_SelDateFrom.Month;
DateTime start = new DateTime(intYear, intMonth, 1);
TimeSpan ts = dt_SelDateTo - dt_SelDateFrom;
int intMthDiff = Convert.ToInt32(Math.Ceiling((ts.TotalDays / 30)));

for (int i = 0; i < intMthDiff; i++)
{
    ChartAxisItem item = new ChartAxisItem();
    item.Value = (decimal)start.AddMonths(i).ToOADate();
    RadChart2.PlotArea.XAxis.AddItem(item);
}

DataTable dt_avg = objBLL.GetSSMTotalImportedLastYearAverage(arrParameters);

// Define chart series
ChartSeries avg_series = new ChartSeries();
avg_series.Appearance.LabelAppearance.Visible = false;
avg_series.Name = "Last Year Average";
avg_series.Type = ChartSeriesType.Line;
avg_series.Appearance.PointMark.Dimensions.Width = 1;
avg_series.Appearance.PointMark.Dimensions.Height = 1;
avg_series.Appearance.PointMark.FillStyle.MainColor = System.Drawing.Color.Black;
avg_series.Appearance.PointMark.FillStyle.FillType = FillType.Solid;
avg_series.Appearance.PointMark.Visible = true;
avg_series.Appearance.LineSeriesAppearance.Color = System.Drawing.Color.Red;

foreach (DataRow row in dt_avg.Rows)
{
    foreach (DataColumn col in dt_avg.Columns)
    {
        Decimal dec_data = Convert.ToDecimal(row[col]);
        Double dbl_data = Convert.ToInt32(dec_data);
        avg_series.AddItem(dbl_data);
    }
}

RadChart2.AddChartSeries(avg_series);

ArrayList arrParameterBaseline = new ArrayList();
arrParameterBaseline.Add(dt_SelBaselineFrom);
arrParameterBaseline.Add(dt_SelBaselineTo);
arrParameterBaseline.Add(dt_SelSSMSeqID);
SqlDataReader dr_baseline = objBLL.GetSSMTotalImportedBaseline(arrParameterBaseline);

ChartSeries baseline_series = new ChartSeries();
baseline_series.Appearance.LabelAppearance.Visible = false;
baseline_series.Name = "Baseline Average";
baseline_series.Type = ChartSeriesType.Line;
baseline_series.Appearance.PointMark.Dimensions.Width = 1;
baseline_series.Appearance.PointMark.Dimensions.Height = 1;
baseline_series.Appearance.PointMark.FillStyle.MainColor = System.Drawing.Color.Black;
baseline_series.Appearance.PointMark.FillStyle.FillType = FillType.Solid;
baseline_series.Appearance.PointMark.Visible = true;
baseline_series.Appearance.LineSeriesAppearance.Color = System.Drawing.Color.Chartreuse;

Double dbl_baseline = 0;

if (dr_baseline == null)
{
    dbl_baseline = 0;
}
else
{
    try
    {
        while (dr_baseline.Read())
        {
            if (dr_baseline["TotalImportedBaseline"] == DBNull.Value)
                dbl_baseline = 0;
            else
            {
                Decimal dec_baseline = dr_baseline.GetDecimal(dr_baseline.GetOrdinal("TotalImportedBaseline"));
                dbl_baseline = Convert.ToDouble(dec_baseline);
            }
        }
    }
    catch (Exception ex)
    {
        AppFunctions.SetMessageError(this.Page, AppConstants.CONST_ERROR_LOAD_CHART);
        AppFunctions.ErrorLog(ex);
    }
    finally
    {
        if (dr_baseline != null)
        {
            dr_baseline.Close();
            dr_baseline.Dispose();
        }
    }
}

for (int i = 0; i < intMthDiff; i++)
{
    baseline_series.AddItem(dbl_baseline);
}

RadChart2.AddChartSeries(baseline_series);

Panel1.Controls.Add(RadChart2);

}
catch (Exception ex)
{
    AppFunctions.SetMessageError(this.Page, AppConstants.CONST_ERROR_LOAD_CHART);
    AppFunctions.ErrorLog(ex);
}
Initially empty Signature has no value -> signatureObject.value() returns undefined. When the control is focused it gets a default value representing the blank background of the signature pad.
Validating the Signature based on its value gets quite complex as it requires considering this default base64string.
It would be great if the control would provide functionality to validate for mandatory user input
If one wants to read the resulting signature server-side (after a button-click / form submission), one kind of has to work with a lot of javascript and hidden input fields to transfer the base64-encoded png towards the server. It would be way nicer if you could provide the content of the signature as a server-side property of the RadSignature-control (during post-back).
See similar requests from the forums:
Hi,
A Feature suggestion to develop a drag-drop Interactive Forms builder, rather than programmatically design a Form. This Feature would simplify and reduce design time to create an Interactive Form for a Designer/User and could be directly integrated into existing applications.
Alan