Currently, the string format (used in the cells generated for the from the DateTimeGroupDescription) is determined automatically based on the selected Step (Day, Month, etc.). Add an option to easily set custom string format.
At this moment, you can change the format only if you create a custom description and override a considerable amount of code. This is shown in the following SDK example: https://github.com/telerik/xaml-sdk/tree/master/PivotGrid/CustomDateTimeGroupDescription
The caption sounds ocnfusing, but i couldn't come up with a better one:
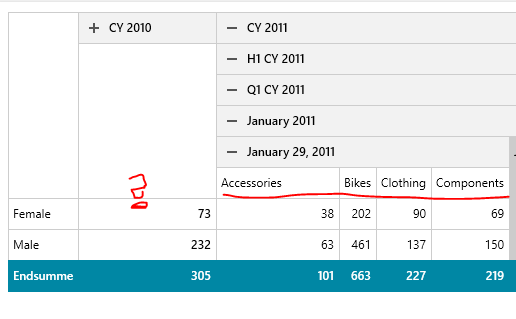
Problem is, if you have hirarchical data like Date.Calendar, you have "sub" values that can be collapsed and expanded
Problem is, when you have more headers, that sit below therese hirarchies, they will be collapsed too.
In this example, "Category" sits below there.
See how the Category is not visible, because Icollapsed the whole year 2010.
Compare that to 2011 where all categories are visible, because its fully expanded.
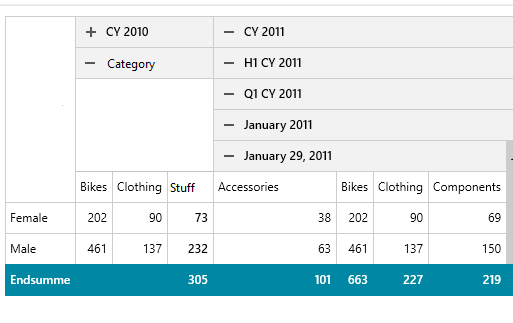
The feature I am requesting here is to still be able to show columns for each category and aggregated values, even though the year is collapsed.
I know this would be acchieved by moving category on top of the headers, but this also changes orders of the columns.

Our old windows forms pivot grid had this kind of functionality.
MSPaint to the rescue, this is how I imagine it (ignore the numbers, they do not make sense)
A sample scenario where this will be useful is if you want to show both the absolute and percentage value of the cells.
Add support for frozen columns. Like in RadGridView or Excel. This way you can scroll the data horizontally while part of the columns are frozen and you can always see them.
We can also consider adding frozen rows like in RadGridView or Excel.
Currently, there is such feature for the row and column group descriptions.
https://docs.telerik.com/devtools/wpf/controls/radpivotgrid/features/localdatasourceprovider/filtering