Legend Item Text is not visible in Windows11Dark. This is because the LegendItem A possible workaround is to subscribe to the VisualItemCreating event. In the event handler, we can create a new LegendItemElement and set its ForeColor.
private void LegendElement_VisualItemCreating(object sender, LegendItemElementCreatingEventArgs e)
{
    e.ItemElement = new LegendItemElement(e.LegendItem) { ForeColor = Color.Black };
}
Before zoom:
After zoom:

Hello Telerik Support,
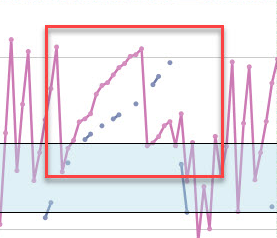
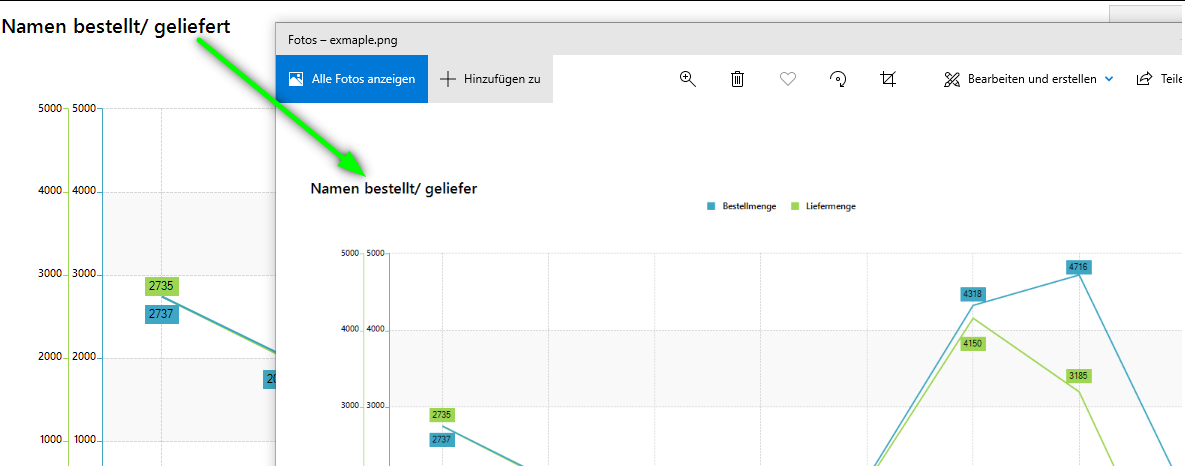
after taking my first steps with RangeSelector and ChartView controls I found an issue with a simple bar chart. The length of some bars in the chart of the RangeSelector doesn't match with the bars in the ChartView. The relation is wrong.I provided a screenshot and marked the bars. I could provide a sample application, but I can't attach a zip file, so here's the code of the main form:
using System;using System.Collections.Generic;using System.ComponentModel;using System.Data;using System.Drawing;using System.Linq;using System.Text;using System.Windows.Forms;using Telerik.WinControls;using Telerik.WinControls.UI;namespace TelerikChartView{ public partial class MainForm : Telerik.WinControls.UI.RadForm { private List<Kapazitaetspunkt> _BackListPunkte; private BindingList<Kapazitaetspunkt> Punkte; public MainForm() { InitializeComponent(); } private void MainForm_Load(object sender, EventArgs e) { _BackListPunkte = new List<Kapazitaetspunkt>(); Punkte = new BindingList<Kapazitaetspunkt>(_BackListPunkte); //Punkte = new BindingList<Kapazitaetspunkt>(); rngTimeSelector.AssociatedControl = cvChart; rngTimeSelector.RangeSelectorElement.ScrollSelectorElement.Visibility = ElementVisibility.Collapsed; BarSeries bars = new BarSeries(); bars.DataSource = Punkte; bars.ValueMember = nameof(Kapazitaetspunkt.Percentage); bars.CategoryMember = nameof(Kapazitaetspunkt.Date); cvChart.Series.Add(bars); } private void GenerateTestData(int addMonths = 0) { Punkte.Clear(); const int count = 25; const int step = 4; var von = DateTime.Today.AddMonths(addMonths); var bis = von.AddDays(count); double percentage = 0; //_BackListPunkte.Add(new Kapazitaetspunkt(von.AddDays(-1), null)); Punkte.Add(new Kapazitaetspunkt(von.AddDays(-1), null)); while (von < bis) { //_BackListPunkte.Add(new Kapazitaetspunkt(von, percentage)); Punkte.Add(new Kapazitaetspunkt(von, percentage)); percentage += step; von = von.AddDays(1); } //_BackListPunkte.Add(new Kapazitaetspunkt(von.AddDays(1), null)); Punkte.Add(new Kapazitaetspunkt(von.AddDays(1), null)); } private void btnGenerateData_Click(object sender, EventArgs e) { GenerateTestData(); rngTimeSelector.RangeSelectorElement.InitializeElements(); rngTimeSelector.RangeSelectorElement.ResetLayout(true); } private void btnGenerateData2_Click(object sender, EventArgs e) { GenerateTestData(2); rngTimeSelector.RangeSelectorElement.InitializeElements(); rngTimeSelector.RangeSelectorElement.ResetLayout(true); } private void rngTimeSelector_ScaleInitializing(object sender, ScaleInitializingEventArgs e) { e.Cancel = true; } } public class Kapazitaetspunkt : INotifyPropertyChanged { private DateTime _Date; public DateTime Date { get => _Date; set { if (value != Date) { _Date = value; OnPropertyChanged(); } } } public double? _Percentage; public double? Percentage { get => _Percentage; set { if (value != Percentage) { _Percentage = value; OnPropertyChanged(); } } } public Kapazitaetspunkt(DateTime date, double? percentage) { Date = date; Percentage = percentage; } public event PropertyChangedEventHandler PropertyChanged; protected virtual void OnPropertyChanged([CallerMemberName] string propertyName = null) { PropertyChanged?.Invoke(this, new PropertyChangedEventArgs(propertyName)); } }}Regards,
Stephan
Please refer to the attached sample project. Try to select a point.
Expected result: the clicked point should be colored in red.
Actual result: a random point is colored in red even though the label is colored correctly. The attached gif file illustrates the observed result.
Please use the following code snippet and click the button to print the chart:
        public RadForm1()
        {
            InitializeComponent();

            Random rand = new Random();
            for (int i = 0; i < 50; i++)
            {
                LineSeries lineSeries = new LineSeries();
                lineSeries.LegendTitle = "Series" + i;
                lineSeries.DataPoints.Add(new CategoricalDataPoint(rand.Next(0,20), "Jan"));
                lineSeries.DataPoints.Add(new CategoricalDataPoint(rand.Next(0,20), "Apr"));
                lineSeries.DataPoints.Add(new CategoricalDataPoint(rand.Next(0,20), "Jul"));
                lineSeries.DataPoints.Add(new CategoricalDataPoint(rand.Next(0,20), "Oct"));
                this.radChartView1.Series.Add(lineSeries);
            }
            this.radChartView1.ShowLegend = true;
            this.radChartView1.ChartElement.LegendPosition = LegendPosition.Bottom;
        }

        private void radButton1_Click(object sender, EventArgs e)
        {
            this.radChartView1.PrintPreview();
        }
Expected:
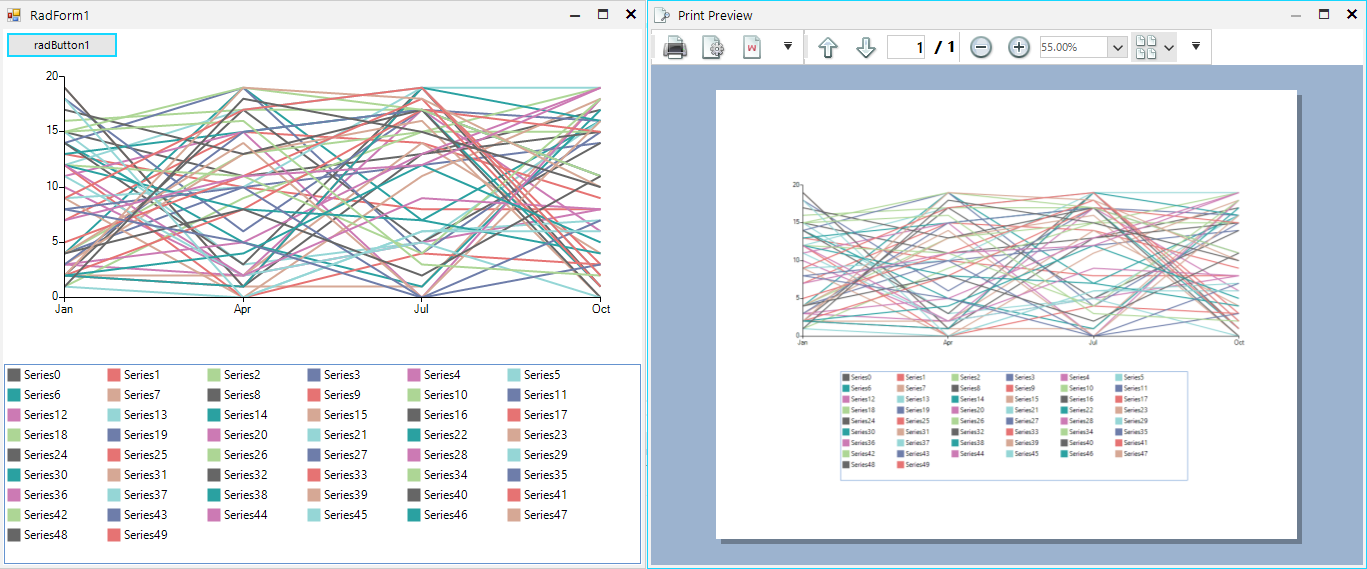
Actual:
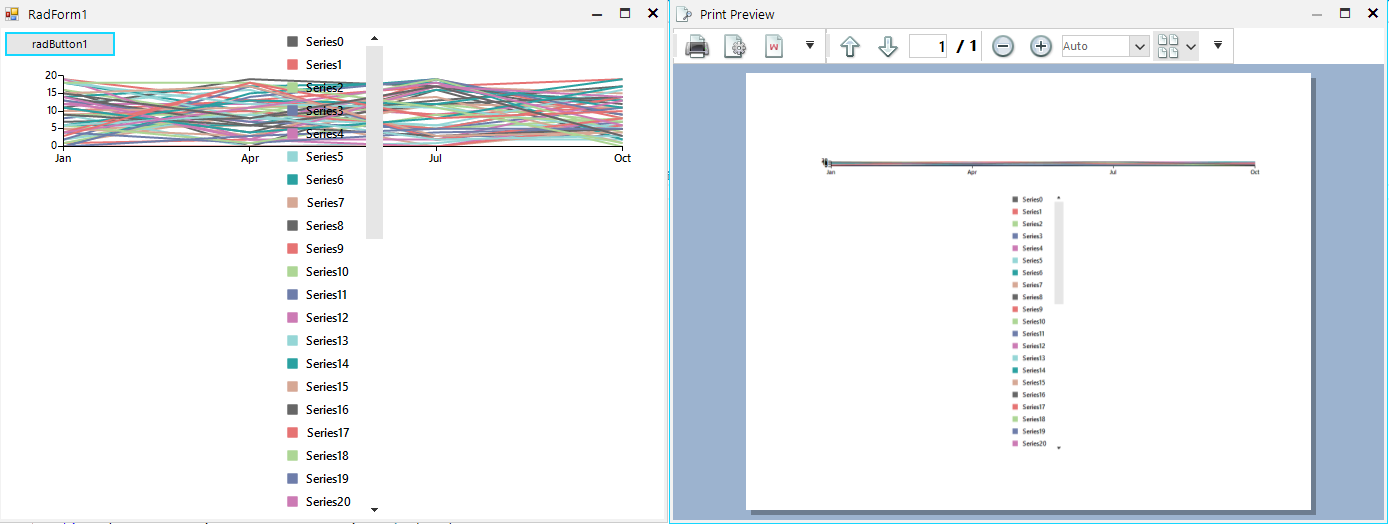
Workaround:
https://docs.telerik.com/devtools/winforms/knowledge-base/chartview-wrap-legend-items
         internal class MyChart : RadChartView
        {
            protected override RadChartElement CreateChartElement()
            {
                return new MyChartElement();
            }
        }

        internal class MyChartElement : RadChartElement
        {
            protected override ChartLegendElement CreateChartLegendElement()
            {
                return new MyLegendElement(this);
            }

            protected override Type ThemeEffectiveType
            {
                get
                {
                    return typeof(RadChartElement);
                }
            }
        }

        internal class MyLegendElement : ChartLegendElement
        {
            private RadListViewElement panel;

            public MyLegendElement(RadChartElement chartElement) : base(chartElement)
            {
            }

            protected override void OnLegendInfosCollectionChanged(Telerik.WinControls.Data.NotifyCollectionChangedEventArgs e, bool providerChange)
            {
                base.OnLegendInfosCollectionChanged(e, providerChange);
                if (e.Action == Telerik.WinControls.Data.NotifyCollectionChangedAction.Add)
                {
                    LegendItem li = e.NewItems[0] as LegendItem;
                    panel.Items.Add(li.Title);
                    panel.Items.Last().Tag = li.Element;
                }
                panel.SelectedIndex = -1;
            }

            protected override void CreateChildElements()
            {
                base.CreateChildElements();
                panel = new RadListViewElement();
                panel.VisualItemFormatting += ListView_VisualItemFormatting;
                panel.ShowCheckBoxes = true;
                panel.StretchHorizontally = true;
                panel.StretchVertically = false;
                panel.ViewType = ListViewType.IconsView;
                panel.ItemSize = new System.Drawing.Size(100, 20);
                panel.ShouldHandleMouseInput = true;
                panel.NotifyParentOnMouseInput = false;
                panel.MaxSize = new System.Drawing.Size(int.MaxValue, 200);
                this.StackElement.Visibility = Telerik.WinControls.ElementVisibility.Collapsed;
                this.Children.Add(panel);
            }

            protected override Type ThemeEffectiveType
            {
                get
                {
                    return typeof(ChartLegendElement);
                }
            }

            private void ListView_VisualItemFormatting(object sender, ListViewVisualItemEventArgs e)
            {
                ListViewItemCheckbox checkBox = e.VisualItem.ToggleElement as ListViewItemCheckbox;
                if (checkBox != null)
                {
                    e.VisualItem.ToggleElement.ShouldHandleMouseInput = false;
                    e.VisualItem.ToggleElement.NotifyParentOnMouseInput = false;
                    checkBox.CheckMarkPrimitive.Fill.BackColor = ((LineSeries)(e.VisualItem.Data.Tag)).BorderColor;
                    checkBox.CheckMarkPrimitive.Fill.GradientStyle = Telerik.WinControls.GradientStyles.Solid;
                    checkBox.CheckMarkPrimitive.Border.Visibility = Telerik.WinControls.ElementVisibility.Collapsed;
                }
            }
        }
System.OverflowException: 'Value was either too large or too small for a Decimal.
To reproduce:
var lineSeries = new LineSeries();
lineSeries.DataPoints.Add(new CategoricalDataPoint(0, "A"));
lineSeries.DataPoints.Add(new CategoricalDataPoint(Convert.ToDouble(decimal.MaxValue), "B"));
lineSeries.DataPoints.Add(new CategoricalDataPoint(0, "C"));
lineSeries.DataPoints.Add(new CategoricalDataPoint(decimal.ToDouble(decimal.MaxValue), "D"));
lineSeries.DataPoints.Add(new CategoricalDataPoint(0, "E"));

this.radChartView1.Series.Add(lineSeries);
To Reproduce, make sure to keep the mouse over the trackball text box.
Please use the following code snippet:
public RadForm1()
{
InitializeComponent();
this.radChartView1.View.AreaType = ChartAreaType.Cartesian;
RangeBarSeries rangeBarSeries = new RangeBarSeries();
rangeBarSeries.DataPoints.Add(new RangeDataPoint(DateTime.Now.TimeOfDay.TotalMinutes + 14, DateTime.Now.TimeOfDay.TotalMinutes + 10, "5/17/2021"));
rangeBarSeries.DataPoints.Add(new RangeDataPoint(DateTime.Now.TimeOfDay.TotalMinutes + 7, DateTime.Now.TimeOfDay.TotalMinutes + 5, "5/17/2021"));
rangeBarSeries.DataPoints.Add(new RangeDataPoint(DateTime.Now.TimeOfDay.TotalMinutes + 4, DateTime.Now.TimeOfDay.TotalMinutes + 2, "5/17/2021"));
rangeBarSeries.DataPoints.Add(new RangeDataPoint(DateTime.Now.TimeOfDay.TotalMinutes + 30, DateTime.Now.TimeOfDay.TotalMinutes + 10, "5/18/2021"));
rangeBarSeries.DataPoints.Add(new RangeDataPoint(DateTime.Now.TimeOfDay.TotalMinutes + 7, DateTime.Now.TimeOfDay.TotalMinutes + 5, "5/18/2021"));
rangeBarSeries.DataPoints.Add(new RangeDataPoint(DateTime.Now.TimeOfDay.TotalMinutes + 4, DateTime.Now.TimeOfDay.TotalMinutes + 2, "5/19/2021"));
rangeBarSeries.DataPoints.Add(new RangeDataPoint(DateTime.Now.TimeOfDay.TotalMinutes - 89, DateTime.Now.TimeOfDay.TotalMinutes - 100, "5/20/2021"));
rangeBarSeries.DataPoints.Add(new RangeDataPoint(DateTime.Now.TimeOfDay.TotalMinutes + 7, DateTime.Now.TimeOfDay.TotalMinutes + 5, "5/20/2021"));
rangeBarSeries.DataPoints.Add(new RangeDataPoint(DateTime.Now.TimeOfDay.TotalMinutes - 79, DateTime.Now.TimeOfDay.TotalMinutes - 90, "5/21/2021"));
rangeBarSeries.DataPoints.Add(new RangeDataPoint(DateTime.Now.TimeOfDay.TotalMinutes + 7, DateTime.Now.TimeOfDay.TotalMinutes + 5, "5/21/2021"));
rangeBarSeries.DataPoints.Add(new RangeDataPoint(DateTime.Now.TimeOfDay.TotalMinutes + 14, DateTime.Now.TimeOfDay.TotalMinutes + 10, "5/22/2021"));
rangeBarSeries.DataPoints.Add(new RangeDataPoint(DateTime.Now.TimeOfDay.TotalMinutes + 7, DateTime.Now.TimeOfDay.TotalMinutes + 5, "5/22/2021"));
rangeBarSeries.DataPoints.Add(new RangeDataPoint(DateTime.Now.TimeOfDay.TotalMinutes + 14, DateTime.Now.TimeOfDay.TotalMinutes + 10, "5/23/2021"));
rangeBarSeries.DataPoints.Add(new RangeDataPoint(DateTime.Now.TimeOfDay.TotalMinutes + 7, DateTime.Now.TimeOfDay.TotalMinutes + 5, "5/23/2021"));
rangeBarSeries.DataPoints.Add(new RangeDataPoint(DateTime.Now.TimeOfDay.TotalMinutes + 14, DateTime.Now.TimeOfDay.TotalMinutes + 10, "5/25/2021"));
rangeBarSeries.DataPoints.Add(new RangeDataPoint(DateTime.Now.TimeOfDay.TotalMinutes + 7, DateTime.Now.TimeOfDay.TotalMinutes + 5, "5/24/2021"));
rangeBarSeries.DataPoints.Add(new RangeDataPoint(DateTime.Now.TimeOfDay.TotalMinutes + 14, DateTime.Now.TimeOfDay.TotalMinutes + 10, "5/26/2021"));
rangeBarSeries.DataPoints.Add(new RangeDataPoint(DateTime.Now.TimeOfDay.TotalMinutes + 7, DateTime.Now.TimeOfDay.TotalMinutes + 5, "5/26/2021"));
this.radChartView1.View.Series.Add(rangeBarSeries);
rangeBarSeries.VerticalAxis.LabelRotationAngle = -45;
rangeBarSeries.VerticalAxis.LabelFitMode = AxisLabelFitMode.Rotate;
LinearAxis verticalAxis = this.radChartView1.View.Axes.Get<LinearAxis>(1);
verticalAxis.Minimum = 0; //Minutes 0:00
verticalAxis.Maximum = 1440; //Minutes 23:00
verticalAxis.MajorStep = 60; //60 minutes in an hour
verticalAxis.LastLabelVisibility = AxisLastLabelVisibility.Hidden;
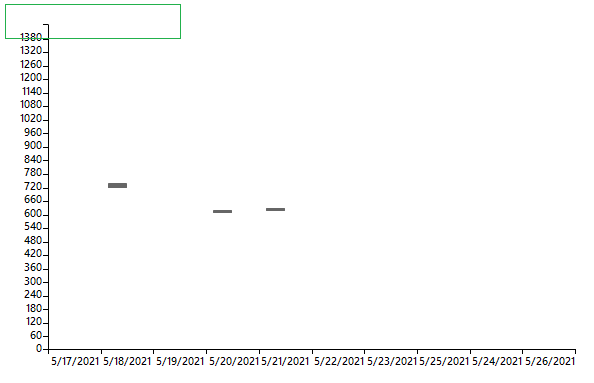
}When the labels are not rotated:
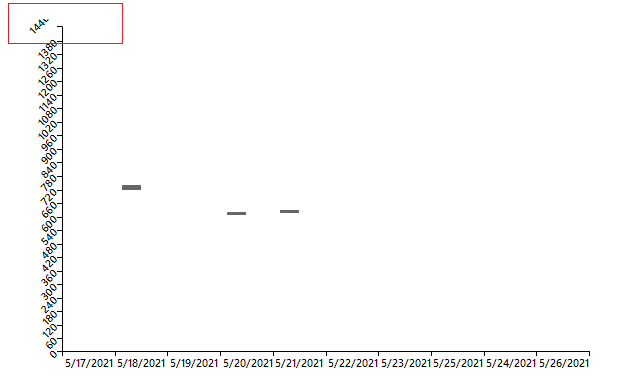
When rotated:
Please use the following code snippet. You will notice that for very long text in the trackball, the fill rectangle doesn't fit the text.
PS. If the legend items occupy enough width of the chart, there wouldn't be sufficient space for the trackball.
        public RadForm1()
        {
            InitializeComponent();

            BarSeries barSeries = new BarSeries("Performance", "RepresentativeName");
            barSeries.LegendTitle = "Q1 This is some sample very long text";
            barSeries.DataPoints.Add(new CategoricalDataPoint(177, "Harley"));
            barSeries.DataPoints.Add(new CategoricalDataPoint(128, "White"));
            barSeries.DataPoints.Add(new CategoricalDataPoint(143, "Smith"));
            barSeries.DataPoints.Add(new CategoricalDataPoint(111, "Jones"));
            barSeries.DataPoints.Add(new CategoricalDataPoint(118, "Marshall"));
            this.radChartView1.Series.Add(barSeries);
            BarSeries barSeries2 = new BarSeries("Performance", "RepresentativeName");
            barSeries2.LegendTitle = "Q2 This is some sample very long text";
            barSeries2.DataPoints.Add(new CategoricalDataPoint(153, "Harley"));
            barSeries2.DataPoints.Add(new CategoricalDataPoint(141, "White"));
            barSeries2.DataPoints.Add(new CategoricalDataPoint(130, "Smith"));
            barSeries2.DataPoints.Add(new CategoricalDataPoint(88, "Jones"));
            barSeries2.DataPoints.Add(new CategoricalDataPoint(109, "Marshall"));
            this.radChartView1.Series.Add(barSeries2);

            this.radChartView1.ShowLegend = true;

            ChartTrackballController trackballController = new ChartTrackballController();
            trackballController.TextNeeded += trackballController_TextNeeded;
            radChartView1.Controllers.Add(trackballController);
        }

        string text = "<html><color=200,200,200,200>This is some sample very long text that wouldn't fit in " +
                      "the default size of the RadChartView from the Telerik UI for WinForms suite</html>";

        private void trackballController_TextNeeded(object sender, TextNeededEventArgs e)
        {
            e.Text = text;
        }
Workaround:
            ChartTrackballController trackballController = new ChartTrackballController();
            trackballController.IsFixedSize = true;
            trackballController.FixedSize = new Size(700, 40);
            trackballController.TextNeeded += trackballController_TextNeeded;
            radChartView1.Controllers.Add(trackballController);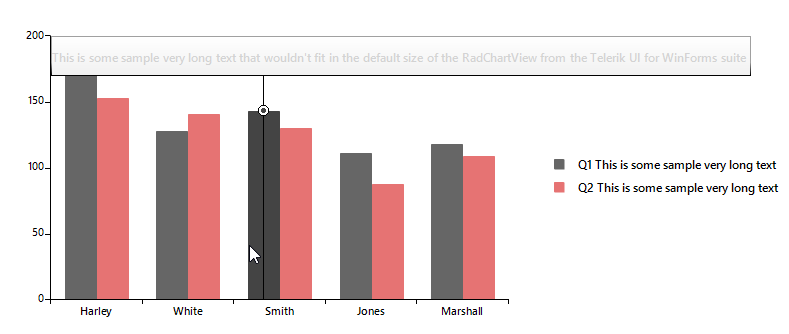
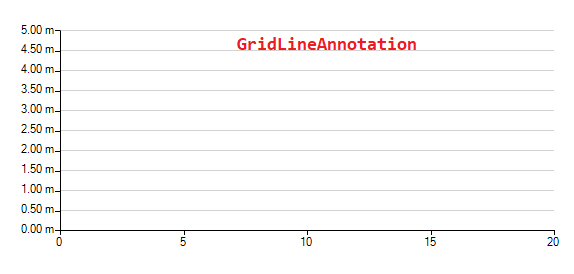
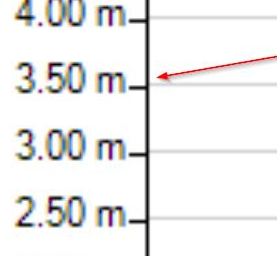
            radChartView1.AreaType = ChartAreaType.Cartesian;
            var scatterSeries = new ScatterSeries();
            scatterSeries.DataPoints.Add(new ScatterDataPoint(15, 19));
            scatterSeries.DataPoints.Add(new ScatterDataPoint(18, 10));
            scatterSeries.DataPoints.Add(new ScatterDataPoint(13, 15));
            scatterSeries.DataPoints.Add(new ScatterDataPoint(10, 8));
            scatterSeries.DataPoints.Add(new ScatterDataPoint(5, 12));
            radChartView1.Series.Add(scatterSeries);

            var verticalAxis = radChartView1.Axes.Get<LinearAxis>(1);
            verticalAxis.Minimum = 0.0d;
            verticalAxis.Maximum = 5.0d;
            verticalAxis.MajorStep = 0.5d;
            verticalAxis.LabelFormat = "{0:0.00} m";

            for (var i = verticalAxis.Minimum; i <= verticalAxis.Maximum; i += verticalAxis.MajorStep)
            {
                var annotation1 = new CartesianGridLineAnnotation();
                annotation1.Axis = this.radChartView1.Axes[1] as CartesianAxis;
                annotation1.BorderColor = Color.LightGray;
                annotation1.BorderDashStyle = DashStyle.Solid;
                annotation1.BorderWidth = 1;
                annotation1.Value = i;
                radChartView1.Annotations.Add(annotation1);
            }
Workaround:
        public RadForm1()
        {
            InitializeComponent();

            this.radChartView1.CreateRenderer += radChartView1_CreateRenderer;
            InitChart();
        }

        private void radChartView1_CreateRenderer(object sender, ChartViewCreateRendererEventArgs e)
        {
            e.Renderer = new CustomRenderer(e.Area as CartesianArea);
        }

        public class CustomRenderer : CartesianRenderer
        {
            public CustomRenderer(CartesianArea area) : base(area)
            {
            }

            protected override void InitializeAnnotations(AnnotationDrawMode drawMode)
            {
                for (int i = 0; i < this.Area.Annotations.Count; i++)
                {
                    if (this.Area.Annotations[i] is CartesianGridLineAnnotation && this.Area.Annotations[i].DrawMode == drawMode)
                    {
                        this.DrawParts.Add(new CustomCartesianGridLineAnnotationDrawPart(this.Area.Annotations[i] as CartesianGridLineAnnotation, this));
                    }
                }
            }
        }

        public class CustomCartesianGridLineAnnotationDrawPart : CartesianGridLineAnnotationDrawPart
        {
            public CustomCartesianGridLineAnnotationDrawPart(CartesianGridLineAnnotation element, CartesianRenderer renderer) : base(element, renderer)
            {
            }

            public override void Draw()
            {
                FieldInfo fi = typeof(CartesianGridLineAnnotation).GetField("model", BindingFlags.Instance | BindingFlags.NonPublic);
                ChartAnnotationModel model = fi.GetValue(this.Element) as ChartAnnotationModel;
                RectangleF rect = ChartRenderer.ToRectangleF(model.LayoutSlot);
                rect.Offset(this.ViewportOffsetX, this.ViewportOffsetY);
                rect.Offset(new PointF(0,1));
                Graphics graphics = this.Renderer.Surface as Graphics;
                RadGdiGraphics radGraphics = new RadGdiGraphics(graphics);

                Rectangle clipRect = ChartRenderer.ToRectangle(this.Element.View.GetArea<CartesianArea>().AreaModel.PlotArea.LayoutSlot);
                clipRect.Offset((int)this.ViewportOffsetX, (int)this.ViewportOffsetY);
                graphics.SetClip(clipRect);

                GraphicsPath path = new GraphicsPath();
                path.AddLine(rect.Location, new PointF(rect.Right, rect.Bottom));

                BorderPrimitiveImpl border = new BorderPrimitiveImpl(this.Element, null);
                border.PaintBorder(radGraphics, null, path, rect);

                rect.Size = graphics.MeasureString(this.Element.Label, this.Element.Font);
                rect.Offset(this.Element.PositonOffset.Width + 1, this.Element.PositonOffset.Height + 1);

                TextParams tp = new TextParams();
                tp.font = this.Element.Font;
                tp.foreColor = this.Element.ForeColor;
                tp.paintingRectangle = new RectangleF(rect.X, rect.Y, rect.Height, rect.Width);
                tp.text = this.Element.Label;

                FillPrimitiveImpl fill = new FillPrimitiveImpl(this.Element, null);
                fill.PaintFill(radGraphics, null, rect);

                radGraphics.DrawString(tp, new SizeF(rect.Height, rect.Width));
            }
        }
Public Class RadForm2
    Public Sub New()
        InitializeComponent()

        AddHandler Me.RadChartView1.CreateRenderer, AddressOf radChartView1_CreateRenderer

        Me.RadChartView1.ShowSmartLabels = True
        Me.RadChartView1.ShowPanZoom = True

        Dim barSeries As New BarSeries()
        Dim barSeries1 As New BarSeries()
        Dim barSeries2 As New BarSeries()
        Dim rand As New Random()
        barSeries.DataPoints.Add(New CategoricalDataPoint(101, 0))
        barSeries1.DataPoints.Add(New CategoricalDataPoint(101, 0))
        barSeries2.DataPoints.Add(New CategoricalDataPoint(101, 0))
        For i As Integer = 1 To 9
            barSeries.DataPoints.Add(New CategoricalDataPoint(rand.[Next](100), i))
            barSeries1.DataPoints.Add(New CategoricalDataPoint(rand.[Next](100), i))
            barSeries2.DataPoints.Add(New CategoricalDataPoint(rand.[Next](100), i))
        Next

        barSeries.ShowLabels = True
        barSeries.DrawLinesToLabels = True
        barSeries1.ShowLabels = True
        barSeries1.DrawLinesToLabels = True
        barSeries2.ShowLabels = True
        barSeries2.DrawLinesToLabels = True

        Me.RadChartView1.Series.Add(barSeries)
        Me.RadChartView1.Series.Add(barSeries1)
        Me.RadChartView1.Series.Add(barSeries2)
    End Sub

    Private Sub radChartView1_CreateRenderer(sender As Object, e As ChartViewCreateRendererEventArgs)
        'e.Renderer = New CustomCartesianRenderer(TryCast(e.Area, CartesianArea))
    End Sub
End Class


Workaround: Create a custom renderer
Public Class CustomCartesianRenderer
    Inherits CartesianRenderer
    Public Sub New(area As CartesianArea)
        MyBase.New(area)
    End Sub

    Protected Overrides Sub Initialize()
        MyBase.Initialize()

        For i As Integer = 0 To Me.DrawParts.Count - 1
            Dim labelPart As BarLabelElementDrawPart = TryCast(Me.DrawParts(i), BarLabelElementDrawPart)
            If labelPart IsNot Nothing Then
                Me.DrawParts(i) = New CustomBarLabelElementDrawPart(DirectCast(labelPart.Element, BarSeries), Me)
            End If
        Next
    End Sub
End Class

Public Class CustomBarLabelElementDrawPart
    Inherits BarLabelElementDrawPart
    Public Sub New(owner As ChartSeries, renderer As IChartRenderer)
        MyBase.New(owner, renderer)
    End Sub

    Public Overrides Sub Draw()
        Dim graphics As Graphics = TryCast(Me.Renderer.Surface, Graphics)
        Dim cartesianSeries As CartesianSeries = TryCast(Me.Element, CartesianSeries)
        If cartesianSeries IsNot Nothing Then
            Dim area As CartesianArea = DirectCast(cartesianSeries.[GetType]().GetField("area", BindingFlags.Instance Or BindingFlags.NonPublic).GetValue(cartesianSeries), CartesianArea)
            Dim clipRect As RectangleF = DirectCast(area.[GetType]().GetMethod("GetCartesianClipRect", BindingFlags.Instance Or BindingFlags.NonPublic).Invoke(area, New Object() {}), RectangleF)

            graphics.SetClip(clipRect)
        End If

        MyBase.Draw()

        graphics.ResetClip()
    End Sub

    Protected Overrides Function GetLineStart(label As LabelElement, point As DataPointElement, isSmartLabel As Boolean) As PointF
        Dim lineStart As PointF = MyBase.GetLineStart(label, point, isSmartLabel)

        Dim x As Single = CSng(TryCast(Me.Element.View, IChartView).PlotOriginX)
        Dim y As Single = CSng(TryCast(Me.Element.View, IChartView).PlotOriginY)

        lineStart.X += x
        lineStart.Y += y

        Return lineStart
    End Function

    Protected Overrides Function GetLineEnd(label As LabelElement, point As DataPointElement, isSmartLabel As Boolean) As PointF
        Dim lineEnd As PointF = MyBase.GetLineEnd(label, point, isSmartLabel)

        If Not isSmartLabel Then
            Dim x As Single = CSng(TryCast(Me.Element.View, IChartView).PlotOriginX)
            Dim y As Single = CSng(TryCast(Me.Element.View, IChartView).PlotOriginY)
            lineEnd.X += x
            lineEnd.Y += y
        End If

        Return lineEnd
    End Function
End Class
Note: similar to the axis, the series should also have ClipLabels property which will control whether the labels will be clipped or not.

How to reproduce: zoom and pan along the chart
public Form1()
{
    InitializeComponent();

    this.radChartView1.CreateRenderer += radChartView1_CreateRenderer;
    this.radChartView1.ShowPanZoom = true;

    BarSeries barSeries = new BarSeries();
    Random rand = new Random();
    for (int i = 1; i < 10; i++)
    {
        barSeries.DataPoints.Add(new CategoricalDataPoint(rand.Next(100), i));
    }

    barSeries.ShowLabels = true;
    this.radChartView1.Series.Add(barSeries);
}

Workaround:
 public partial class Form1 : Form
 {
     public Form1()
     {
         InitializeComponent();

         this.radChartView1.CreateRenderer += radChartView1_CreateRenderer;
         this.radChartView1.ShowPanZoom = true;

         BarSeries barSeries = new BarSeries();
         Random rand = new Random();
         for (int i = 1; i < 10; i++)
         {
             barSeries.DataPoints.Add(new CategoricalDataPoint(rand.Next(100), i));
         }

         barSeries.ShowLabels = true;
         this.radChartView1.Series.Add(barSeries);
     }

     private void radChartView1_CreateRenderer(object sender, ChartViewCreateRendererEventArgs e)
     {
         e.Renderer = new CustomCartesianRenderer(e.Area as CartesianArea);
     }
 }

 public class CustomCartesianRenderer : CartesianRenderer
 {
     public CustomCartesianRenderer(CartesianArea area)
         : base(area)
     { }
     protected override void Initialize()
     {
         base.Initialize();

         for (int i = 0; i < this.DrawParts.Count; i++)
         {
             BarLabelElementDrawPart labelPart = this.DrawParts[i] as BarLabelElementDrawPart;
             if (labelPart != null)
             {
                 this.DrawParts[i] = new CustomLabelElementDrawPart((BarSeries)labelPart.Element, this);
             }
         }
     }
 }

 public class CustomLabelElementDrawPart : BarLabelElementDrawPart
 {
     public CustomLabelElementDrawPart(ChartSeries owner, IChartRenderer renderer)
         : base(owner, renderer)
     { }

     public override void Draw()
     {
         Graphics graphics = this.Renderer.Surface as Graphics;
         CartesianSeries cartesianSeries = this.Element as CartesianSeries;
         if (cartesianSeries != null)
         {
             CartesianArea area = (CartesianArea)cartesianSeries.GetType().GetField("area", BindingFlags.Instance | BindingFlags.NonPublic).GetValue(cartesianSeries);
             RectangleF clipRect = (RectangleF)area.GetType().GetMethod("GetCartesianClipRect", BindingFlags.Instance | BindingFlags.NonPublic).Invoke(area, new object[] { });//.GetCartesianClipRect();
             graphics.SetClip(clipRect);
         }

         base.Draw();

         graphics.ResetClip();
     }
 }
I need to draw a series of graphs and show the legend. When the legend does not fit in the RadChartView, a scroll bar appears - this is acceptable, you can quickly see the whole legend. But the title of the legend is cut off.
Please refer to the attached sample project. Select a range from RadRangeSelector and print the chart. You will notice that the preview chart is shifted. Even if the the default margin is reduced to 0, the preview chart is not the same as the one displayed on the form.
Workaround: export the chart to a file which file can be printed: https://docs.telerik.com/devtools/winforms/controls/chartview/features/export
Hi team,
We need a ChartView with multiple series and multiple Y-axis. The axis color of each Y-axis should be automatically painted according to the palette setting (thank you for the brilliant work - it's very intuitive). However, if clear the series and re-assign a new set of series, the border color of the first axis changes to black, regardless which palette is active. If the palette is set to a new one, the border color can be re-painted correctly. See screenshot as attached.
How to reproduce: Please refer to the attached project for a demo of reproduction. Click the first button to populate new random data. The border color of the first axis should change to black after clicking the button twice and more times. Clicking the second button will force the palette to change and the border color will become normal.
Thank you, team.
Best,
Yusi
When you have BarSeries and LineSeries in RadChartView the problem is that the DataPoint.Presenter is always BarSerries, never LineSeries.
To workaround, create custom renderer:
this.radChartView1.CreateRenderer += this.RadChartView1_CreateRenderer;
private void RadChartView1_CreateRenderer(object sender, ChartViewCreateRendererEventArgs e)
{
    e.Renderer = new CustomCartesianRenderer(e.Area as CartesianArea);
}

public class CustomCartesianRenderer : CartesianRenderer
{
    public CustomCartesianRenderer(CartesianArea area)
        : base(area)
    { }
    public override DataPoint HitTest(int x, int y)
    {
        for (int i = this.DrawParts.Count - 1; i >= 0; i--)
        {
            DataPoint dataPoint = this.DrawParts[i].HitTest(new Point(x, y));
            if (dataPoint != null)
            {
                return dataPoint;
            }
        }

        return base.HitTest(x, y);
    }
}
Hi Team,
Can you please share sample or demo code for candlestick graph (C# winform).
Thanks
Use attached to reproduce.
- Click at least 7 times.
Workaround: Crete new series instance each time.