Use the following setup:
private void RadForm1_Load(object sender, EventArgs e)
{
// TODO: This line of code loads data into the 'nwindDataSet.Orders' table. You can move, or remove it, as needed.this.ordersTableAdapter.Fill(this.nwindDataSet.Orders);
this.radPivotGrid1.RowGroupDescriptions.Add(new DateTimeGroupDescription() { PropertyName = "OrderDate", Step = DateTimeStep.Year, GroupComparer = new GroupNameComparer() });
this.radPivotGrid1.RowGroupDescriptions.Add(new DateTimeGroupDescription() { PropertyName = "OrderDate", Step = DateTimeStep.Quarter, GroupComparer = new GroupNameComparer() });
this.radPivotGrid1.RowGroupDescriptions.Add(new DateTim
eGroupDescription() { PropertyName = "OrderDate", Step = DateTimeStep.Month, GroupComparer = new GroupNameComparer() });
this.radPivotGrid1.ColumnGroupDescriptions.Add(new PropertyGroupDescription() { PropertyName = "EmployeeID", GroupComparer = new GrandTotalComparer() });
this.radPivotGrid1.AggregateDescriptions.Add(new PropertyAggregateDescription() { PropertyName = "Freight", AggregateFunction = AggregateFunctions.Sum });
this.radPivotGrid1.AggregateDescriptions.Add(new PropertyAggregateDescription() { PropertyName = "Freight", AggregateFunction = AggregateFunctions.Average });
this.radPivotGrid1.FilterDescriptions.Add(new PropertyFilterDescription() { PropertyName = "ShipCountry", CustomName = "Country" });
this.radPivotGrid1.DataSource = this.ordersBindingSource;
this.radPivotGrid1.ChartDataProvider.UpdateCompleted += radPivotGrid1_UpdateCompleted;
this.radChartView1.DataSource = this.radPivotGrid1;
}
private void radPivotGrid1_UpdateCompleted(object sender, EventArgs e)
{
foreach (CartesianSeries series inthis.radChartView1.Series)
{
series.ShowLabels = true;
series.LabelRotationAngle = 90;
}
}
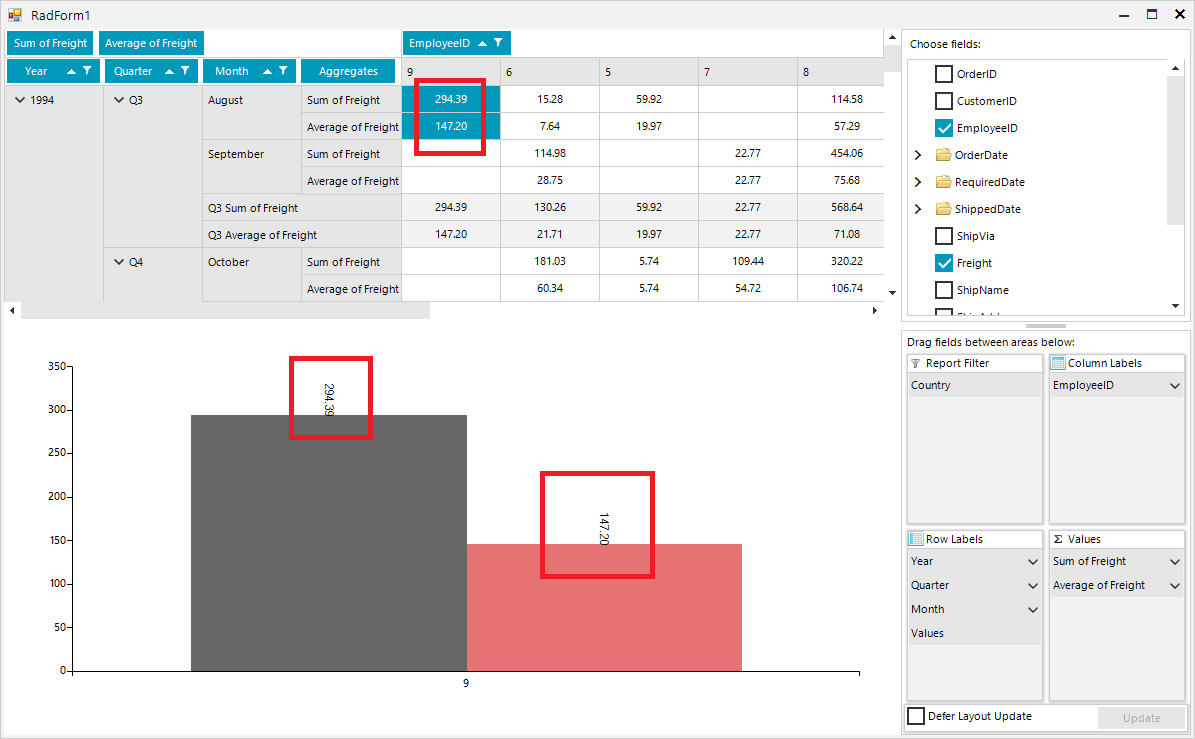
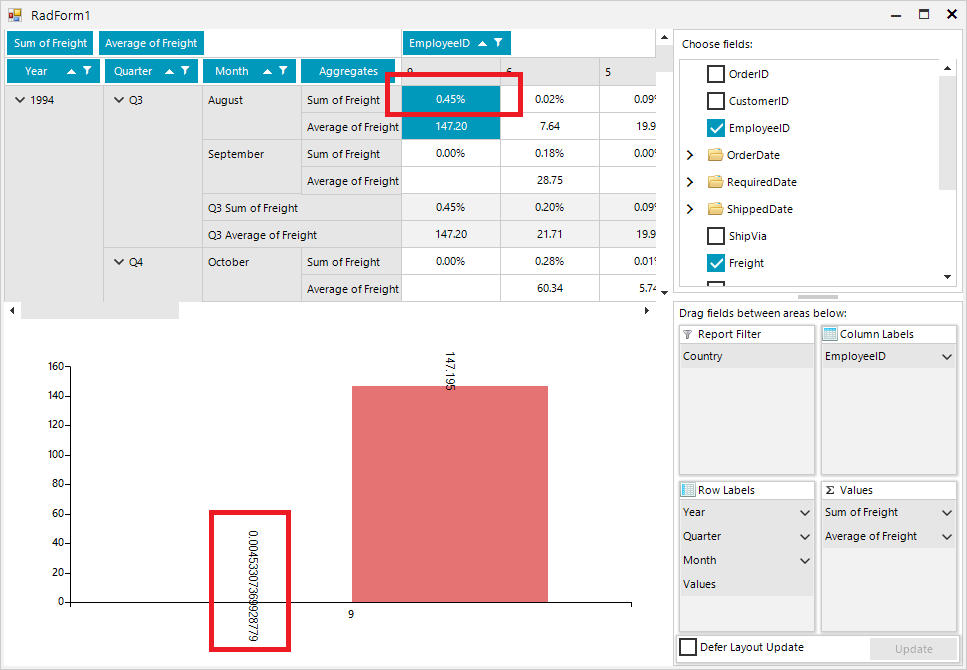
Once you select "% of Grand Total" for one of the aggregates, it would be good the respective chart labels to be formatted in a similar way out of the box:

Desired Behavior:
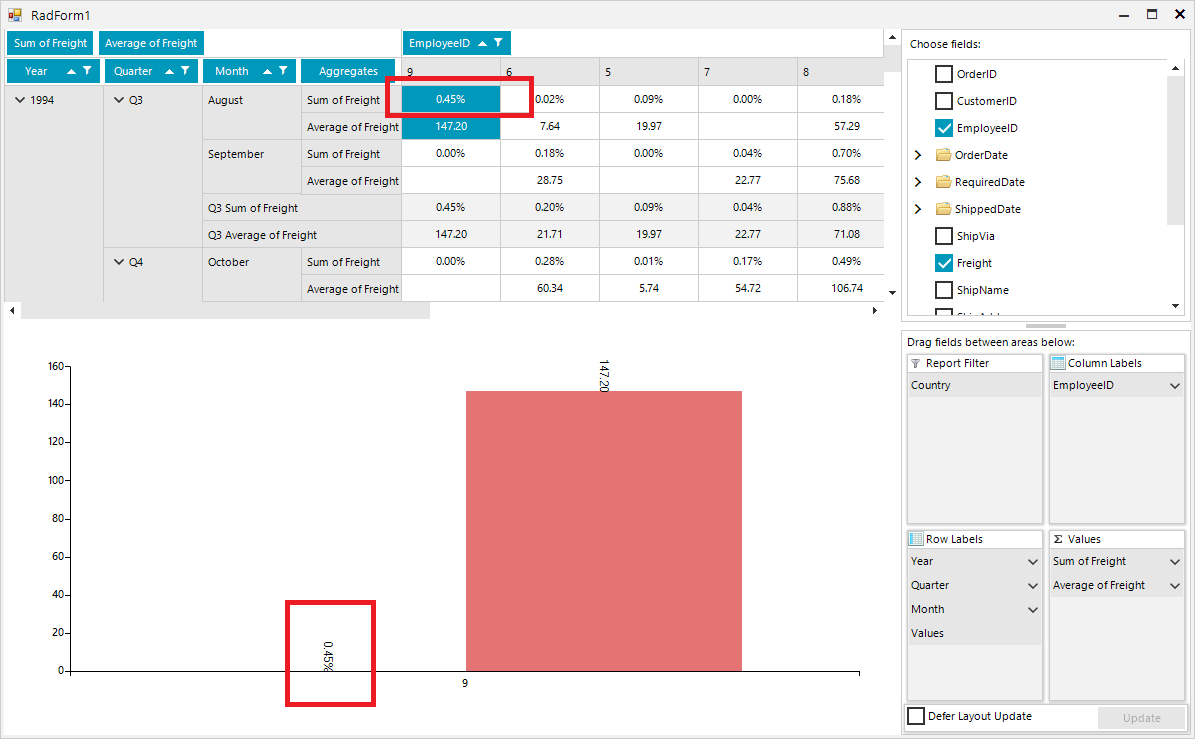
Actual behavior:
Currently, VisualStudio2012DarkTheme has a white background in order to be able to read the labels. This change was done when addressing this item:
However, it is inconsistent a dark theme to have a white background color. The design should be improved to achieve consistent look and feel.
Improve performance, when calculating the positions of Smart Labels.
Good day,
My requierment is to have a RadChartView with a LineSeries and a RangeSeries. I add CategoricalDataPoint objects manually to the LineSeries and I manually add RangeDataPoint objects to the RangeSeries.
When I encounter NULL valued datapoints, for the LineSeries, I do the following. The NULL valued datapoints appear as gaps in the chart as expected.
Dim value As Nullable(Of Double)
Dim serControl  As  LineSeries

serControl = New LineSeries()
chart.Series.Add(serControl)
value = IIf(IsDBNull(dr(data.ControlParameter.ID.ToString())), New Nullable(Of Double), dr(data.ControlParameter.ID.ToString()))
serControl.DataPoints.Add(New Telerik.Charting.CategoricalDataPoint(value))
However the RangeSeries do not handle the NULL valued datapoints the same. I get the following error: Nullable object must have a value.
Dim LowerBound, UpperBound As Nullable(Of Double)
Dim serRange  As  RangeSeries

serRange = New RangeSeries()
chart.Series.Add(serRange)
LowerBound = IIf(IsDBNull(dr("Lowerbound"), New Nullable(Of Double), dr("LowerBound"))
UpperBound = IIf(IsDBNull(dr("Upperbound"), New Nullable(Of Double), dr("UpperBound"))
serRange.DataPoints.Add(New Telerik.Charting.RangeDataPoint(UpperBound, LowerBound))
I need to be able to show gaps, not zero's in a RangeSeries when there are NULL values.
How can I do this?
Currently, RadChartView offers exporting to a Bitmap in one of the following formats: https://docs.microsoft.com/en-us/dotnet/api/system.drawing.imaging.imageformat?view=netframework-4.8
It would be nice to have export functionality to a vector image.
The same issue can be observed in a DPI-aware application on higher scaling
Workaround: set the RadControl.EnableDpiScaling property to false

public partial class Form1 : Form
{
    public Form1()
    {
        RadControl.EnableDpiScaling = false;

        InitializeComponent();

        LineSeries lineSeries = new LineSeries();
        lineSeries.DataPoints.Add(new CategoricalDataPoint(20, "Jan"));
        lineSeries.DataPoints.Add(new CategoricalDataPoint(22, "Apr"));
        lineSeries.DataPoints.Add(new CategoricalDataPoint(12, "Jul"));
        lineSeries.DataPoints.Add(new CategoricalDataPoint(19, "Oct"));
        this.radChartView1.Series.Add(lineSeries);

        LineSeries lineSeries2 = new LineSeries();
        lineSeries2.DataPoints.Add(new CategoricalDataPoint(18, "Jan"));
        lineSeries2.DataPoints.Add(new CategoricalDataPoint(15, "Apr"));
        lineSeries2.DataPoints.Add(new CategoricalDataPoint(17, "Jul"));
        lineSeries2.DataPoints.Add(new CategoricalDataPoint(22, "Oct"));
        this.radChartView1.Series.Add(lineSeries2);

        LassoZoomController lassoZoomController = new LassoZoomController();
        radChartView1.Controllers.Add(lassoZoomController);
    }

    private void radButton1_Click(object sender, EventArgs e)
    {
        this.radChartView1.ExportToImage(@"..\..\image.png", this.radChartView1.Size);
    }
}
The new controller should allow lasso selection of data points without zooming the view port.
It would be great to be able to generate Box Plot graphics, both in the RadCharView control and in the Report.
https://demos.telerik.com/kendo-ui/radar-charts/radar-column

The attached proejct shows a sample implementation.
When setting the border color of the axis the labels are showing a border with the same color. The color is inherited from the axis element. One should be able to easily disable this, or it should not happen.

How to reproduce:
public partial class RadForm1 : Telerik.WinControls.UI.RadForm
{
    LineSeries lineSeries;

    public RadForm1()
    {
        InitializeComponent();

        this.lineSeries = new LineSeries();

        this.lineSeries.DataPoints.Add(new CategoricalDataPoint(20, "Jan"));
        this.lineSeries.DataPoints.Add(new CategoricalDataPoint(22, "Apr"));
        this.lineSeries.DataPoints.Add(new CategoricalDataPoint(25, "Jul"));
        this.lineSeries.DataPoints.Add(new CategoricalDataPoint(19, "Oct"));

        this.radChartView1.Series.Add(this.lineSeries);

        this.lineSeries.HorizontalAxis.BorderColor = Color.Green;
        this.lineSeries.VerticalAxis.BorderColor = Color.Blue;
    }
}

Workaround: iterate each of the axis labels and set their border color to Transparent
public partial class RadForm1 : Telerik.WinControls.UI.RadForm
{
    LineSeries lineSeries;

    public RadForm1()
    {
        InitializeComponent();

        this.lineSeries = new LineSeries();

        this.lineSeries.DataPoints.Add(new CategoricalDataPoint(20, "Jan"));
        this.lineSeries.DataPoints.Add(new CategoricalDataPoint(22, "Apr"));
        this.lineSeries.DataPoints.Add(new CategoricalDataPoint(25, "Jul"));
        this.lineSeries.DataPoints.Add(new CategoricalDataPoint(19, "Oct"));

        this.radChartView1.Series.Add(this.lineSeries);

        this.lineSeries.HorizontalAxis.BorderColor = Color.Green;
        this.lineSeries.VerticalAxis.BorderColor = Color.Blue;
    }

    protected override void OnShown(EventArgs e)
    {
        base.OnShown(e);

        foreach (var item in this.lineSeries.VerticalAxis.Children)
        {
            AxisLabelElement label = item as AxisLabelElement;
            if (label != null)
            {
                label.BorderColor = Color.Transparent;
            }
        }

        foreach (var item in this.lineSeries.HorizontalAxis.Children)
        {
            AxisLabelElement label = item as AxisLabelElement;
            if (label != null)
            {
                label.BorderColor = Color.Transparent;
            }
        }
    }
}