Unplanned
Last Updated:
05 Jul 2022 10:06
by Bradley
Created by:
Bradley
Comments:
0
Category:
Chart
Type:
Feature Request
creation of a line graph on a scatter point chart with gaps in the line when expected values are missing
Something like this:
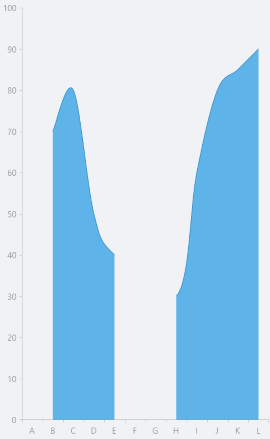
Something like this:
Unplanned
Last Updated:
14 Jun 2022 14:05
by David
Created by:
David
Comments:
0
Category:
Chart
Type:
Feature Request
Currently the only way to apply different colors to the bars is through the ChartPalette. Provide an option to set the color according to the bound data item.