Recently Updated
Unplanned
Last Updated:
25 Mar 2024 11:22
by ADMIN
Created by:
John
Comments:
0
Category:
Diagram
Type:
Feature Request
SVG Example:

            <svg>
                <defs>
                    <pattern id="Occupied"
                            width="4" height="10"
                            patternUnits="userSpaceOnUse"
                            patternTransform="rotate(45 50 50)">
                        <line stroke="#ffb29d" stroke-width="2" y2="10"/>
                    </pattern>
                </defs>
                <rect x="5" y="5"
                      width="40" height="100"
                      fill="url(#Occupied)"
                      stroke="#ff7094"
                      stroke-width="1" />
            </svg>
Unplanned
Last Updated:
23 Feb 2024 22:02
by Roy
Created by:
Roy
Comments:
0
Category:
Diagram
Type:
Feature Request
Hi Team,
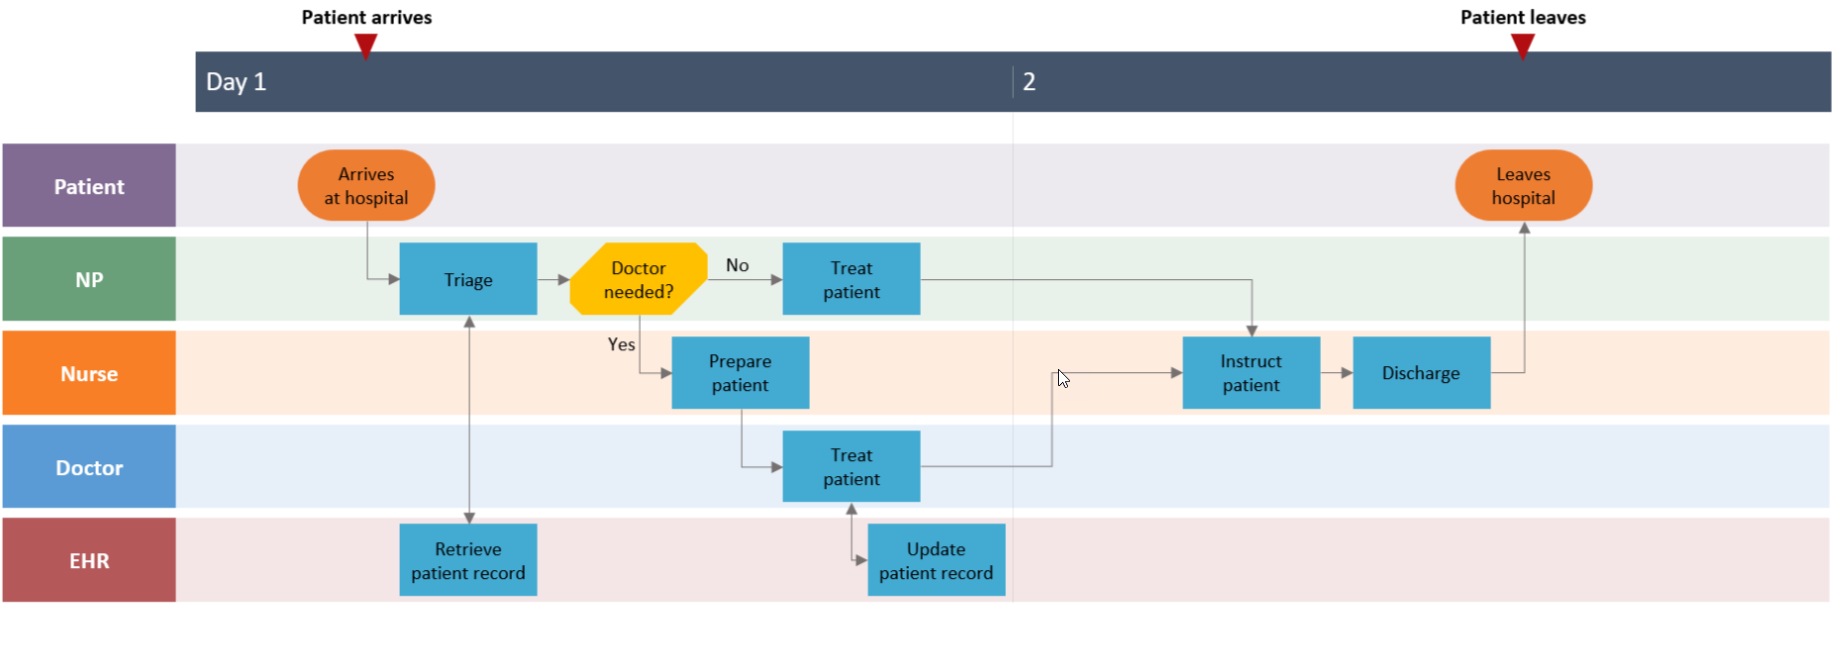
I would like to request adding Swimlane Orientation for the Kendo UI Diagram.
Thank you!
Unplanned
Last Updated:
14 Jul 2023 11:58
by ADMIN
Created by:
Monica
Comments:
4
Category:
Diagram
Type:
Feature Request
Expand/Collapse feature on click of the diagram nodes.
Load data on demand during enpansion of the node.
Unplanned
Last Updated:
05 May 2022 09:05
by Divyesh
Created by:
Divyesh
Comments:
1
Category:
Diagram
Type:
Feature Request
Enhancement
Expose renderAs property in Diagram as it is in Chart
TicketID: 1563168
Environment
Kendo UI version: ]all]
Browser: [all]
Unplanned
Last Updated:
02 May 2022 17:46
by Divyesh
Created by:
Divyesh
Comments:
0
Category:
Diagram
Type:
Feature Request
Hi Team,
I'd like to request the functionality to inject HTML code using the Kendo UI Drawing API. Specifically, being able to utilize a Node Container with the Drawing API would be great.
Thank you!
Unplanned
Last Updated:
27 Aug 2021 08:51
by Diana
Created by:
Imported User
Comments:
6
Category:
Diagram
Type:
Feature Request
What about adding dynamic scrollbars to the HTML5 Diagram widget?

As developer I'm familiar with the pan and zoom concept, but customers and normal users are expected to see scroll bars to move around a diagram.
In this demo

http://demos.telerik.com/kendo-ui/html5-diagram-sample-app

you can add objects that fall outside of the main view, but no scroll bars appears.

Here http://kendoui-feedback.telerik.com/forums/127393-telerik-kendo-ui-feedback/suggestions/6552432-html5-diagram-control-allow-scrolling

was posted a similar request, but the scrollbars Kenshin suggested
are static.

The scrollbars does't readapt if the work area changes.

If you move objects around, apply a different zoom, add more elements, and so on.
Unplanned
Last Updated:
12 Aug 2021 13:18
by ADMIN
Created by:
mustufa
Comments:
0
Category:
Diagram
Type:
Feature Request
I want the content to be divide into two lines. So I tried setting `connectionDefaults.content.visual` with the below function:


            var getConnection = function (data) {
            var g = new kendo.dataviz.diagram.Group({
                autoSize: true
            });
            var text1 = new kendo.dataviz.diagram.TextBlock({
                text: data.label.name,
                fontSize: 16
            });


            g.append(text1);

            var text2 = new kendo.dataviz.diagram.TextBlock({
                text: data.label.value,
                fontSize: 16
            });


            g.append(text2);
            return g;
        }
But the problem here is that the `data` field does not populate the connection data due to which assigning values is not possible.


A solution for this is much appreciated.
Unplanned
Last Updated:
12 Aug 2021 13:16
by ADMIN
Created by:
Eitan
Comments:
0
Category:
Diagram
Type:
Feature Request
Currently, a shape that is a group of inner shapes is selected by clicking anywhere inside its bounding box.
However, when there's a gap between the inner shapes through which you see another shapes, clicking that other shape will not select it due to the bounding box.
If instead the selection was based on the inner shapes, that wouldn't be a problem.
Unplanned
Last Updated:
25 May 2021 10:45
by ADMIN
Created by:
Les Baker
Comments:
0
Category:
Diagram
Type:
Feature Request
It would be great to have a "shadow" property and customization settings for shapes. That would take the visual appeal of these controls clearly to the next level. Same request for "corners" as in rounding/settings.
Unplanned
Last Updated:
22 Apr 2021 10:40
by ADMIN
Created by:
Imported User
Comments:
3
Category:
Diagram
Type:
Feature Request
Extend Dataviz Diagram to implement a BPMN Editor using
Unplanned
Last Updated:
07 Jan 2021 18:33
by ADMIN
Created by:
Joel
Comments:
0
Category:
Diagram
Type:
Feature Request
Hi Team,
I'd like to request the Kendo UI Diagram to include a double click event in future releases similar to the click event.
Thank you
Unplanned
Last Updated:
01 Apr 2020 09:37
by ADMIN
Created by:
Diego
Comments:
0
Category:
Diagram
Type:
Feature Request
Add ability to define connection visual template option for the whole connection path. In this way the user can define custom connection types (like 'polyspline' ).
Someting like:
Unplanned
Last Updated:
12 Feb 2020 11:47
by ADMIN
Created by:
Valentino
Comments:
1
Category:
Diagram
Type:
Feature Request
Tooltip for Shapes in Diagram
Unplanned
Last Updated:
12 Feb 2020 11:40
by ADMIN
Created by:
Jeremiah
Comments:
0
Category:
Diagram
Type:
Feature Request
Implement containers for the Kendo UI Diagram much like Telerik's RadDiagram for WPF and Silverlight. The containers need to be able to support connections within parent containers (essentially need to be able to create an entire child diagram within each container). These containers must also be able to be moved as a unit when the user drags and drops the containers around on the screen.
Unplanned
Last Updated:
12 Feb 2020 11:35
by ADMIN
Created by:
Peter
Comments:
0
Category:
Diagram
Type:
Feature Request
It would be nice if the diagram control could have undo/redo event.
Unplanned
Last Updated:
12 Feb 2020 11:35
by ADMIN
Created by:
Martin
Comments:
0
Category:
Diagram
Type:
Feature Request
It would love to have an export feature for Diagram which will give the possibilty to make an export to Microsoft Visio.
Unplanned
Last Updated:
12 Feb 2020 11:34
by ADMIN
Created by:
Michał
Comments:
0
Category:
Diagram
Type:
Feature Request
It should be allowed to extend the Diagram plot area to more than 20000px and/or to calculate the max scroll width based on the Diagram content.
Unplanned
Last Updated:
12 Feb 2020 11:34
by ADMIN
Created by:
Zentraler
Comments:
1
Category:
Diagram
Type:
Feature Request
Automatic Layout and Data Source in case of non-TreeView data

In the diagram control automatic layout and data source works just for a tree view. For example in a non tree view data we would have several levels with items that can have multiple parents. In this case I have to create the items in the diagram manually...it would be nice to update this behaviour and to be able to use the diagram with automatic data source and layout also in the case of a non TreeView data.
Unplanned
Last Updated:
12 Feb 2020 11:24
by ADMIN
Created by:
Imported User
Comments:
0
Category:
Diagram
Type:
Feature Request
It will be nice to create shapes with rounded borders
Unplanned
Last Updated:
12 Feb 2020 11:22
by ADMIN
Created by:
Eitan
Comments:
0
Category:
Diagram
Type:
Feature Request
Add built-in support for guidelines that will be visible as an infinite grid of lines, with a snap-to capability.