Hi Team,
I would like to request adding Swimlane Orientation for the Kendo UI Diagram.
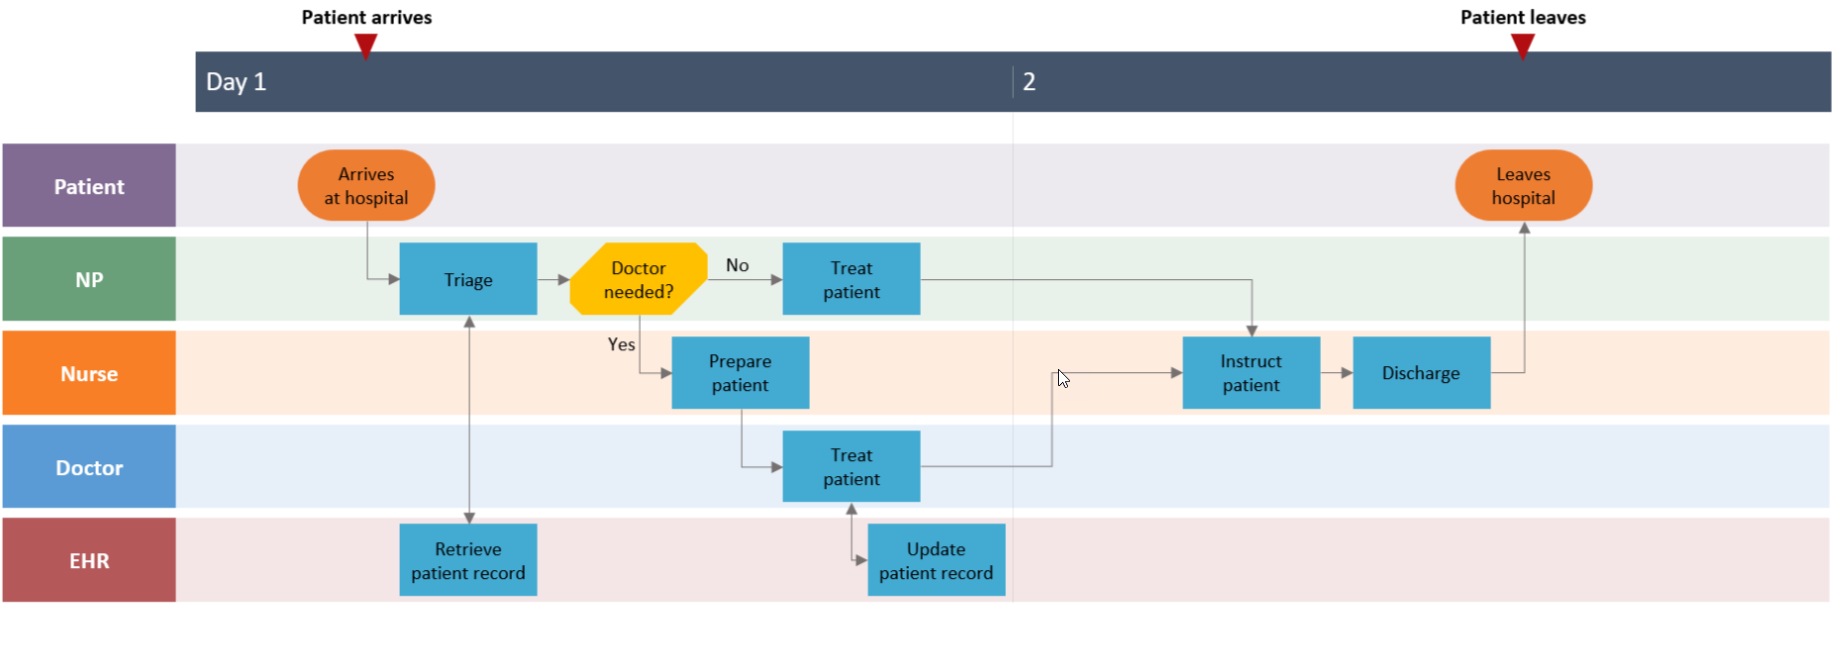
Thank you!
Enhancement
Expose renderAs property in Diagram as it is in Chart
TicketID: 1563168
Environment
Kendo UI version: ]all]
Browser: [all]
Hi Team,
I'd like to request the functionality to inject HTML code using the Kendo UI Drawing API. Specifically, being able to utilize a Node Container with the Drawing API would be great.
Thank you!
Hi Team,
I'd like to request the Kendo UI Diagram to include a double click event in future releases similar to the click event.
Thank you
Add ability to define connection visual template option for the whole connection path. In this way the user can define custom connection types (like 'polyspline' ).
Someting like:
Hi,
Your documentation mentions the rotation-thumb and also allows for some styling:
https://docs.telerik.com/kendo-ui/api/javascript/dataviz/ui/diagram/configuration/editable.rotate
The only problem is, I cannot get it to display.
See: https://jsfiddle.net/6qmgj521/
Beware: I do NOT mean the 90 degree rotation buttons in the toolbar, but the rotation-thumb adorner!
I expect to see:
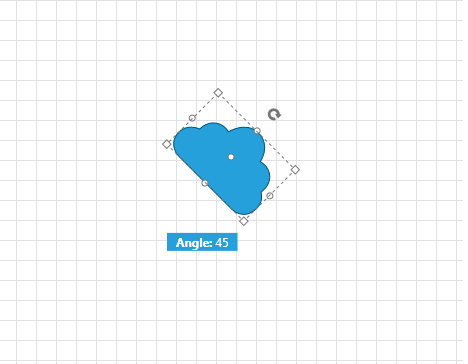
Kind regards,
Hans van Essen
The data item is available to the event arguments of the function handler for shapeDefaults.content.visual function but it is not available to connectionDefaults.content.visual Function. Here is an example illustrating the issue: https://dojo.telerik.com/EMAzeruG
Can it be added?
Fish Bone diagram is a nice feature which is very useful for the applications to provide the root cause analysis in any vertical.
Syncfusion is having a nice in built control to do the same.
https://ej2.syncfusion.com/demos/diagram/fishbone-diagram/
A similar feature from Kendo UI is needed to include it in our existing applications.
It should be allowed to extend the Diagram plot area to more than 20000px and/or to calculate the max scroll width based on the Diagram content.
SVG Example:

            <svg>
                <defs>
                    <pattern id="Occupied"
                            width="4" height="10"
                            patternUnits="userSpaceOnUse"
                            patternTransform="rotate(45 50 50)">
                        <line stroke="#ffb29d" stroke-width="2" y2="10"/>
                    </pattern>
                </defs>
                <rect x="5" y="5"
                      width="40" height="100"
                      fill="url(#Occupied)"
                      stroke="#ff7094"
                      stroke-width="1" />
            </svg>
I find the documentation is critically lacking with regards to the available options for a feature.

Here is an example of what I mean...

http://docs.telerik.com/kendo-ui/api/javascript/dataviz/diagram/layout#configuration-alignContent

The diagram Layout > alignContent feature "Specifies the alignment of the content."

Ok, but the documentation does not even say what the allowed values are. Instead, it just has "alignContent String (default: "start")".

Now, I guess the allowed values here are the same values allowed for an SVG text-anchor.
https://developer.mozilla.org/en-US/docs/Web/SVG/Attribute/text-anchor

How about adding those possible values to the api documentation, or including a link to the relevant area of the SVG specification?

Hope this makes sense.
It would love to have an export feature for Diagram which will give the possibilty to make an export to Microsoft Visio.
Expand/Collapse feature on click of the diagram nodes.
Load data on demand during enpansion of the node.
I want the content to be divide into two lines. So I tried setting `connectionDefaults.content.visual` with the below function:


            var getConnection = function (data) {
            var g = new kendo.dataviz.diagram.Group({
                autoSize: true
            });
            var text1 = new kendo.dataviz.diagram.TextBlock({
                text: data.label.name,
                fontSize: 16
            });


            g.append(text1);

            var text2 = new kendo.dataviz.diagram.TextBlock({
                text: data.label.value,
                fontSize: 16
            });


            g.append(text2);
            return g;
        }
But the problem here is that the `data` field does not populate the connection data due to which assigning values is not possible.


A solution for this is much appreciated.
Currently, a shape that is a group of inner shapes is selected by clicking anywhere inside its bounding box.
However, when there's a gap between the inner shapes through which you see another shapes, clicking that other shape will not select it due to the bounding box.
If instead the selection was based on the inner shapes, that wouldn't be a problem.
Its good to have minimize and maximize the shapes drawn with kendo diagram as seen in this example
https://gojs.net/latest/samples/IVRtree.html

it will very useful when we are drawing with a huge data. we can clearly see the actual flow as required
It would be nice if the diagram control could have undo/redo event.
Add built-in support for guidelines that will be visible as an infinite grid of lines, with a snap-to capability.
What about adding dynamic scrollbars to the HTML5 Diagram widget?

As developer I'm familiar with the pan and zoom concept, but customers and normal users are expected to see scroll bars to move around a diagram.
In this demo

http://demos.telerik.com/kendo-ui/html5-diagram-sample-app

you can add objects that fall outside of the main view, but no scroll bars appears.

Here http://kendoui-feedback.telerik.com/forums/127393-telerik-kendo-ui-feedback/suggestions/6552432-html5-diagram-control-allow-scrolling

was posted a similar request, but the scrollbars Kenshin suggested
are static.

The scrollbars does't readapt if the work area changes.

If you move objects around, apply a different zoom, add more elements, and so on.