### Bug report
The legend items cannot be configured in the SeriesDefaults() configuration of the Pie Chart.
### Reproduction of the problem
1) Create a Pie Chart with a visible legend.
2) Add the SeriesDefaults() configuration and try to add the LegendItem() option to set the type of the legend items.
.SeriesDefaults(seriesDefaults =>
{
    seriesDefaults
            .Pie();
            .LegendItem(x => x
                .Type("line")
                .Line(y => y.DashType(ChartDashType.Solid)));
})
The Legenditem() option is available for Telerik UI for ASP.NET Core Pie Chart.
### Expected/desired behavior
The legend items of the Pie Chart must be configurable through the SeriesDefaults() option.
### Environment
* **Telerik UI for ASP.NET MVC version: 2024.1.319
* **Browser: [all]
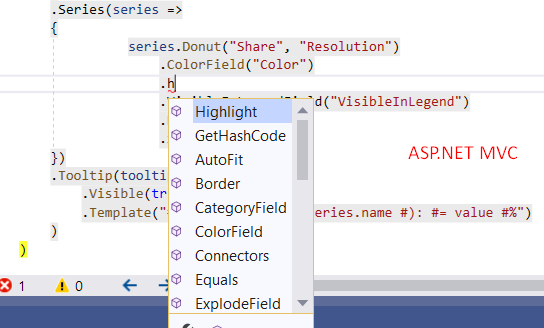
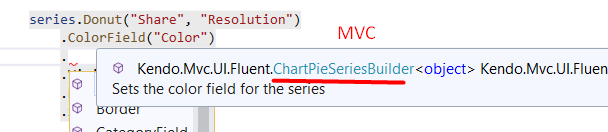
Using Kendo through MVC creation. Create any chart with @(Html.Kendo().Chart()) code. Plug in a color into any property: Font.Color, MajorGridLines.Color, Series.Color (line, area, column), ValueAxis.Color etc. The color should be a hex string in the format of #102030. The pound character in here messes up the ToClientTemplate() method or alternatively the parsing of that finished template back on the Kendo scripts.
A workaround is to instead use rgb(16, 32, 48) since the # character is not there.
For now I added this extension method if it helps anyone who stumbles along to this.
public static string ToRgbColor(this string hexColor) {
   var color = ColorTranslator.FromHtml(hexColor);
   if (color.A == 255) {
      return $"rgb({color.R},{color.G},{color.B})";
   }
   else {
      return $"rgba({color.A},{color.R},{color.G},{color.B})";
   }
}
The method is not available for the MVC wrappers but it is available for ASP.NET Core.
Hello,
I noticed that the date format from my current kendo culture (fr-FR) is not applied properly for Weeks and Days units on xAxis labels of a chart with date axis.
I had to set the property DateFormats for Weeks and Days of my XAxis Labels to force the format (other units work fine) :
@(Html.Kendo.Chart(Of Models.DataViewModel).
        Name("chart").
        Title(typeMesure.GetDescription()).
        DataSource(Sub(dataSource)
                       dataSource.Read(Sub(read)
                                           read.Type(HttpVerbs.Get).Action("GetData","Data"))
                                       End Sub).
                                       Sort(Sub(sort) sort.Add(Function(m) m.Dt).Ascending())
                   End Sub).
                            Series(Sub(series) series.
                                        ScatterLine(Function(m) m.Dt, Function(m) m.Value).
                                        Markers(False).
                                        MissingValues(ChartScatterLineMissingValues.Gap).
                                        Color("#cb1d39").
                                        Tooltip(Sub(tooltip)
                                                    tooltip.Visible(True).
                                                    Template("Date : #= kendo.toString(value.x, 'dd/MM/yyyy HH:mm') # <br/>Valeur : #= kendo.toString(value.y, 'n3') #")
                                                End Sub)).
                            XAxis(Sub(xAxis) xAxis.Date().
                                        Min(Model.DateDebut).
                                        Max(Model.DateFin).
                                        Labels(Sub(labels) labels.DateFormats(Sub(dateFormats) dateFormats.Weeks("dd/MM").Days("dd/MM")))).
                            Panes(Sub(panes) panes.Add().Clip(False)).
                            Pannable(True).
                            Zoomable(Sub(zoomable)
                                         zoomable.Mousewheel(Sub(mousewheel) mousewheel.Lock(ChartAxisLock.Y)).
                                         Selection(Sub(selection) selection.Lock(ChartAxisLock.Y))
                                     End Sub))
Could you please fix this issue in a future version ?
Thanks and regards.