Completed
Last Updated:
20 Aug 2019 09:32
by ADMIN
Created by:
John
Comments:
1
Category:
Chart
Type:
Feature Request
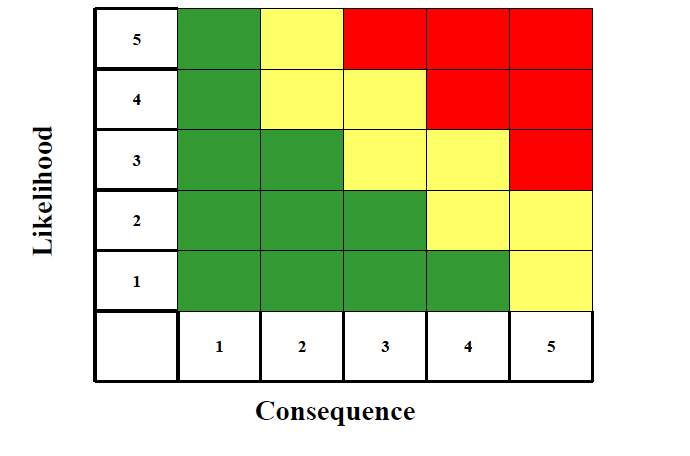
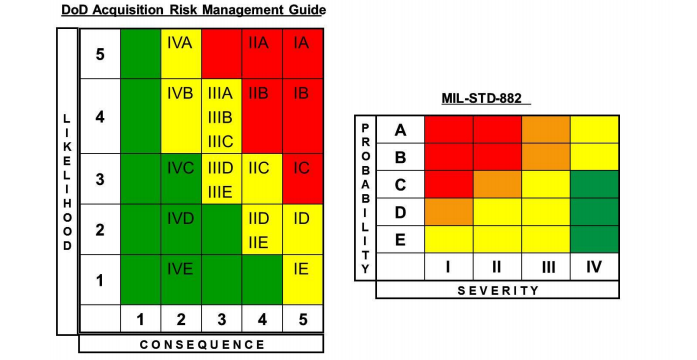
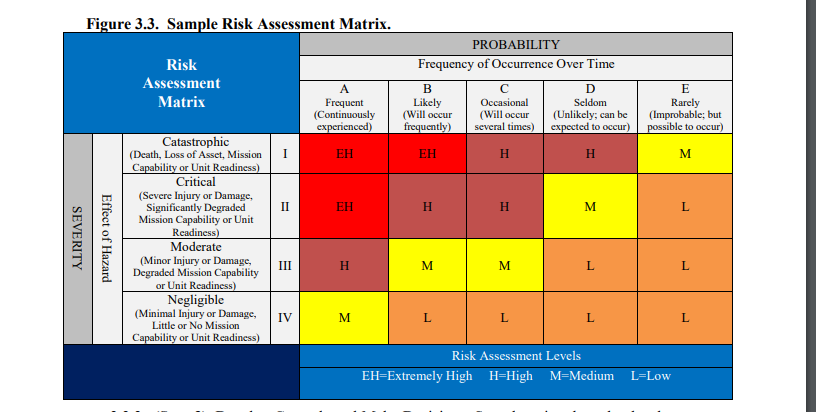
We have the need to create a chart to display Risk Information. Below is the image of a risk matrix as defined on pages 96 in AFPAM63-128 https://static.e-publishing.af.mil/production/1/saf_aq/publication/afpam63-128/afpam63-128.pdf -- there are more examples on page 101
Another example of a risk matrix can be seen on page 18 here -> https://static.e-publishing.af.mil/production/1/af_se/publication/afi90-802/afi90-802.pdf
I've copied the images here for convenience.
Would it be possible to add this to the Kendo Chart backlog?
Completed
Last Updated:
11 Jan 2021 14:33
by ADMIN
Created by:
Jonathan
Comments:
2
Category:
Chart
Type:
Feature Request
I have a large data array (>300 items) that are in the format (double, DateTime). It would be great to allow the entire array to be shown on the chart in both a mobile and desktop experience that would allow the user to pan, zoom, and scroll to see the data.