the new feature request would be to increase the sensibility for markers beyond the points shape limit, as drawn below:
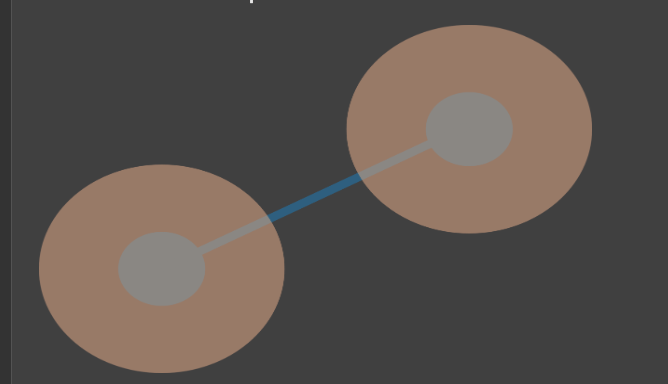
If sensibility areas are distinct and user click on point or in its surronding sensibility area, user will get point marker with point value.
Thus, this feature should ease point marker selection, without the need to tap the exact point with great accuracy.
They should be keyboard accessible while navigating using tab key to support accessibility.
Example - https://www.telerik.com/kendo-react-ui/components/charts/series-types/line/
Is it possible to create a click event for a chart plotband? so not on the plot area but on a plotband itself? If so please provide a stackblitz example.

Thanks
Hello,
we have a probelm with the current bar chart control in react.
We need a multi grouping on the x axis like in Excel and tried a lot but couldn't find any solution yet.
The following image shows how we would like to implement. The x-axis is grouped by two attributes (Age, Gender) .
Is there any possiblity to do this due fusioncharts support it a bit more as your controls ?
Kind regards, Volker

Is it possible to use a custom border radius for individual bars of a stacked bar chart?
According to the Docs, it looks like we are limited to: color, dashType and width but was wondering if I am missing something or there is another way?
https://www.telerik.com/kendo-react-ui/components/charts/api/Border/
Thank you!